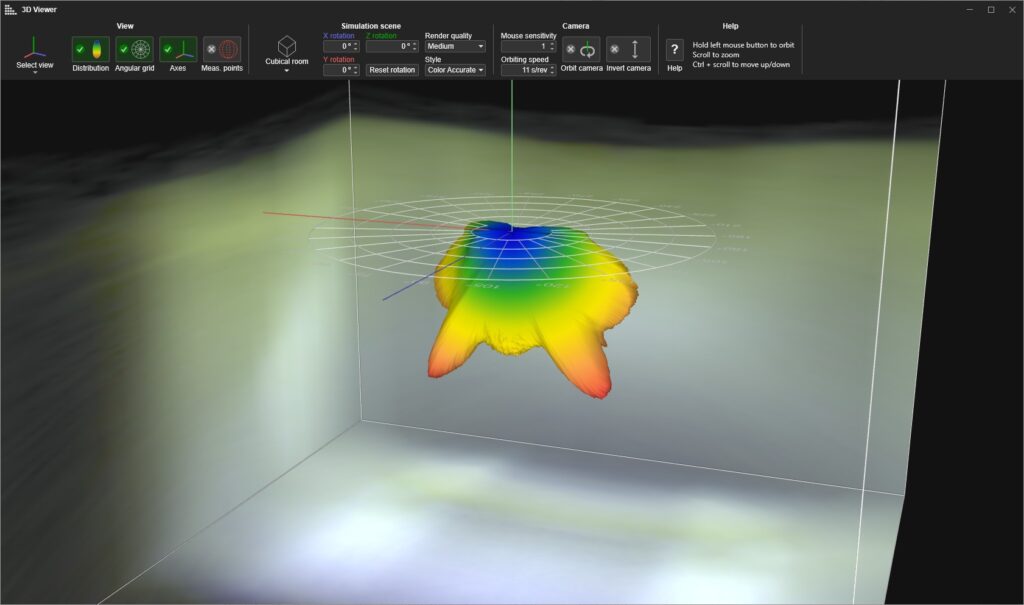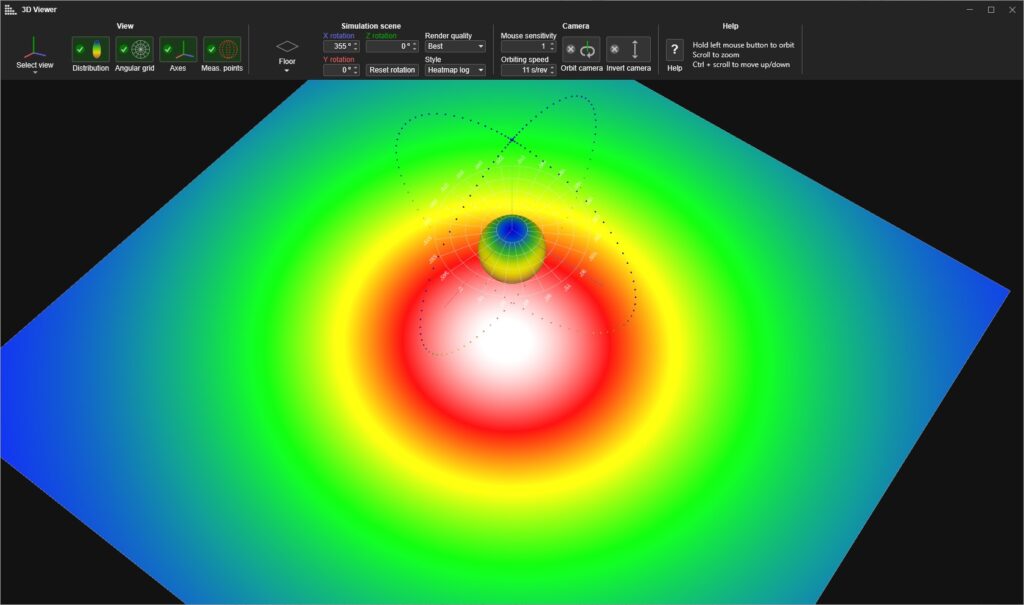

Perhaps you are used to analyzing your light measurements by exporting them to Excel and performing your own calculations and graphs? Now there is good news for you and your team: Use Light Inspector software directly for your studies. The latest tool is the new, advanced 3D viewer. Not only does it show your light distribution curve as a 3D object with a heat map, but it also offers several new features, that you will not find in any other software:
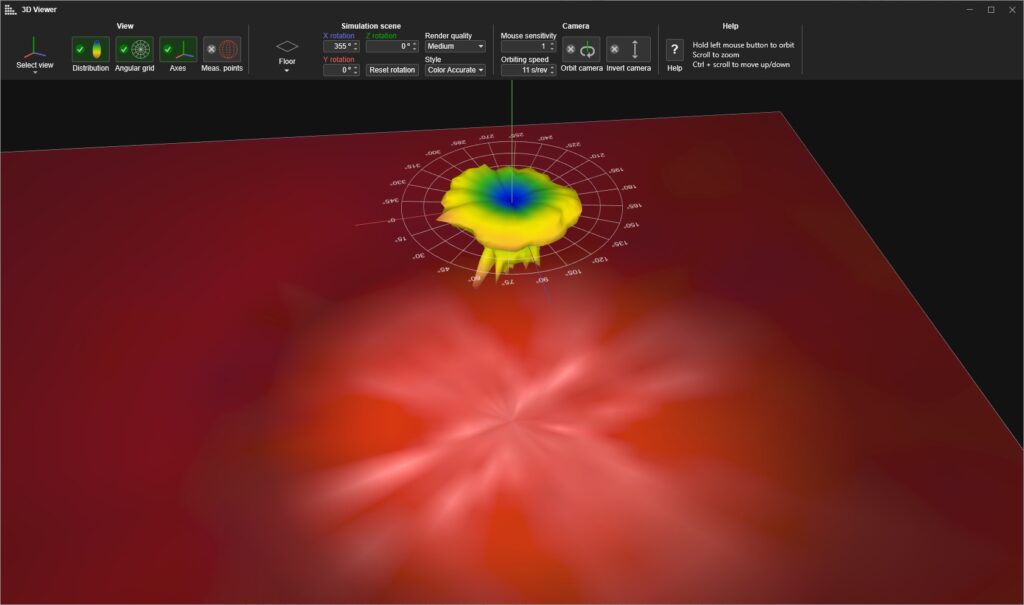
- You can let the light hit a virtual room or a nearby surface
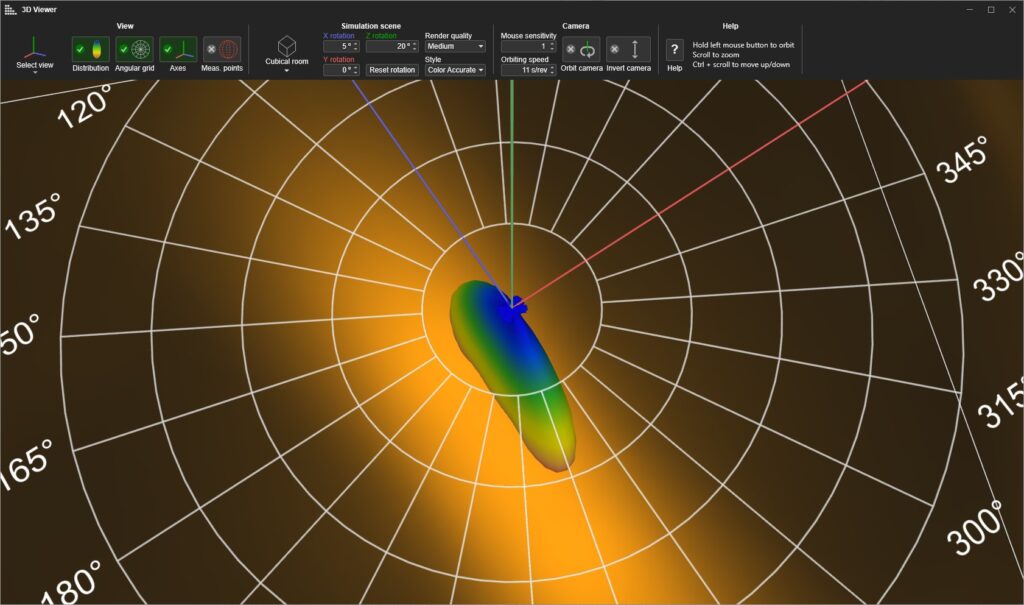
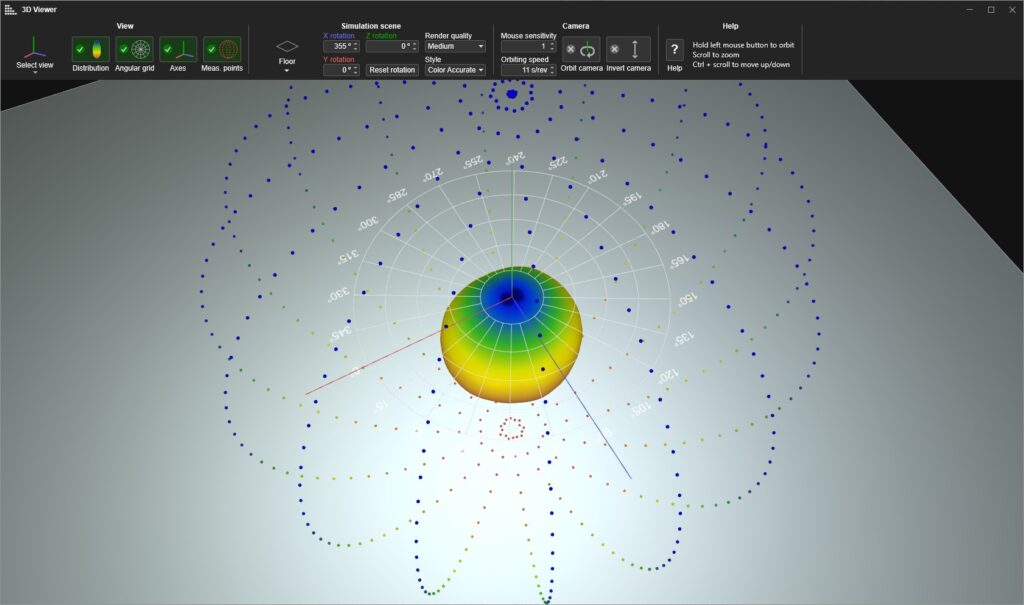
- This light distribution has the light color measured by the spectrometer. So if, for example, your light source does not have the same color temperature everywhere, this will be revealed here.
- The 3D viewer can show all your measurement points as a cloud around the distributions, giving you an impression of the quality of the measurement.
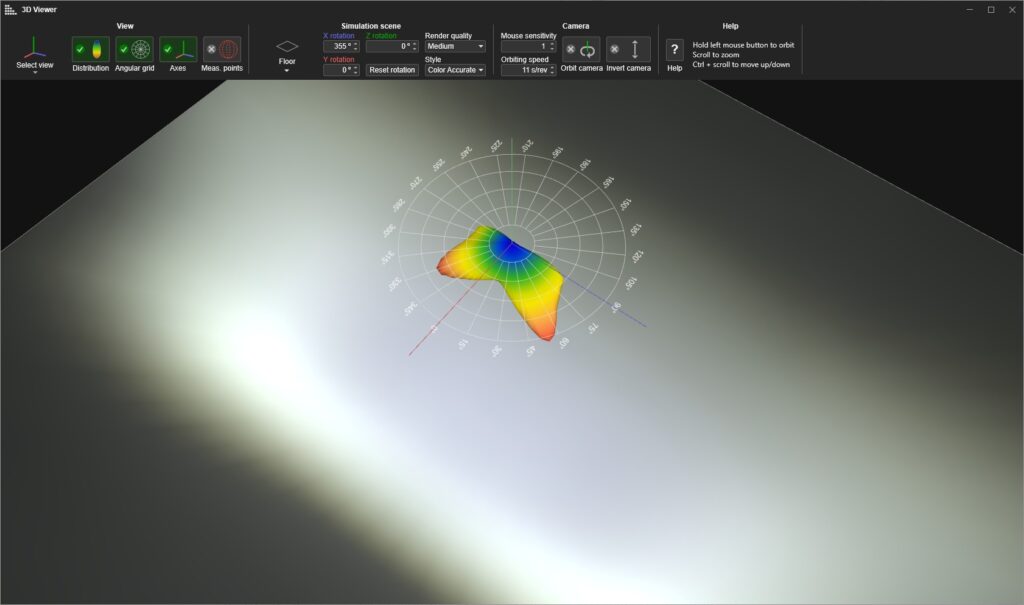
- You can zoom in and see the smallest details.