We are ready to assist you
Viso Media Relations work to serve members of the press quickly and professionally with e.g. text, stories and proprietary images.
Please contact technical sales director Anne Bay at
anne.bay(at)visosystems.com or call +45 29 63 87 40
Press release 23 MAR 2021
To kill germs with UV light, what really matters is exposure time. But how is UV light distributed in a real space and how long should UV lamps be on? 3D UV light measurements combined with the free planning software DIALux leads to much safer implementation of germicidal UV.
Why settle for point UV measurements when you can get 3D? Germicidal UV radiation (GUV) has become extremely popular due to the COVID-19 pandemic. As stated by the CIE in May 2020 , it is very important that GUV is applied with appropriate attention to dose and safety. However, the GUV business is immature, and practical measurements are dominated by handheld instruments and simple dosimeter cards.
With goniospectrometry in the UV range (200-400 nm) it is possible to quantify UV radiation in the same way as visible light. In fact, it is possible to make UV 3D light distribution files (.IES or .LDT formats) and work with them in a standard light planning software such as Relux and DIALux.
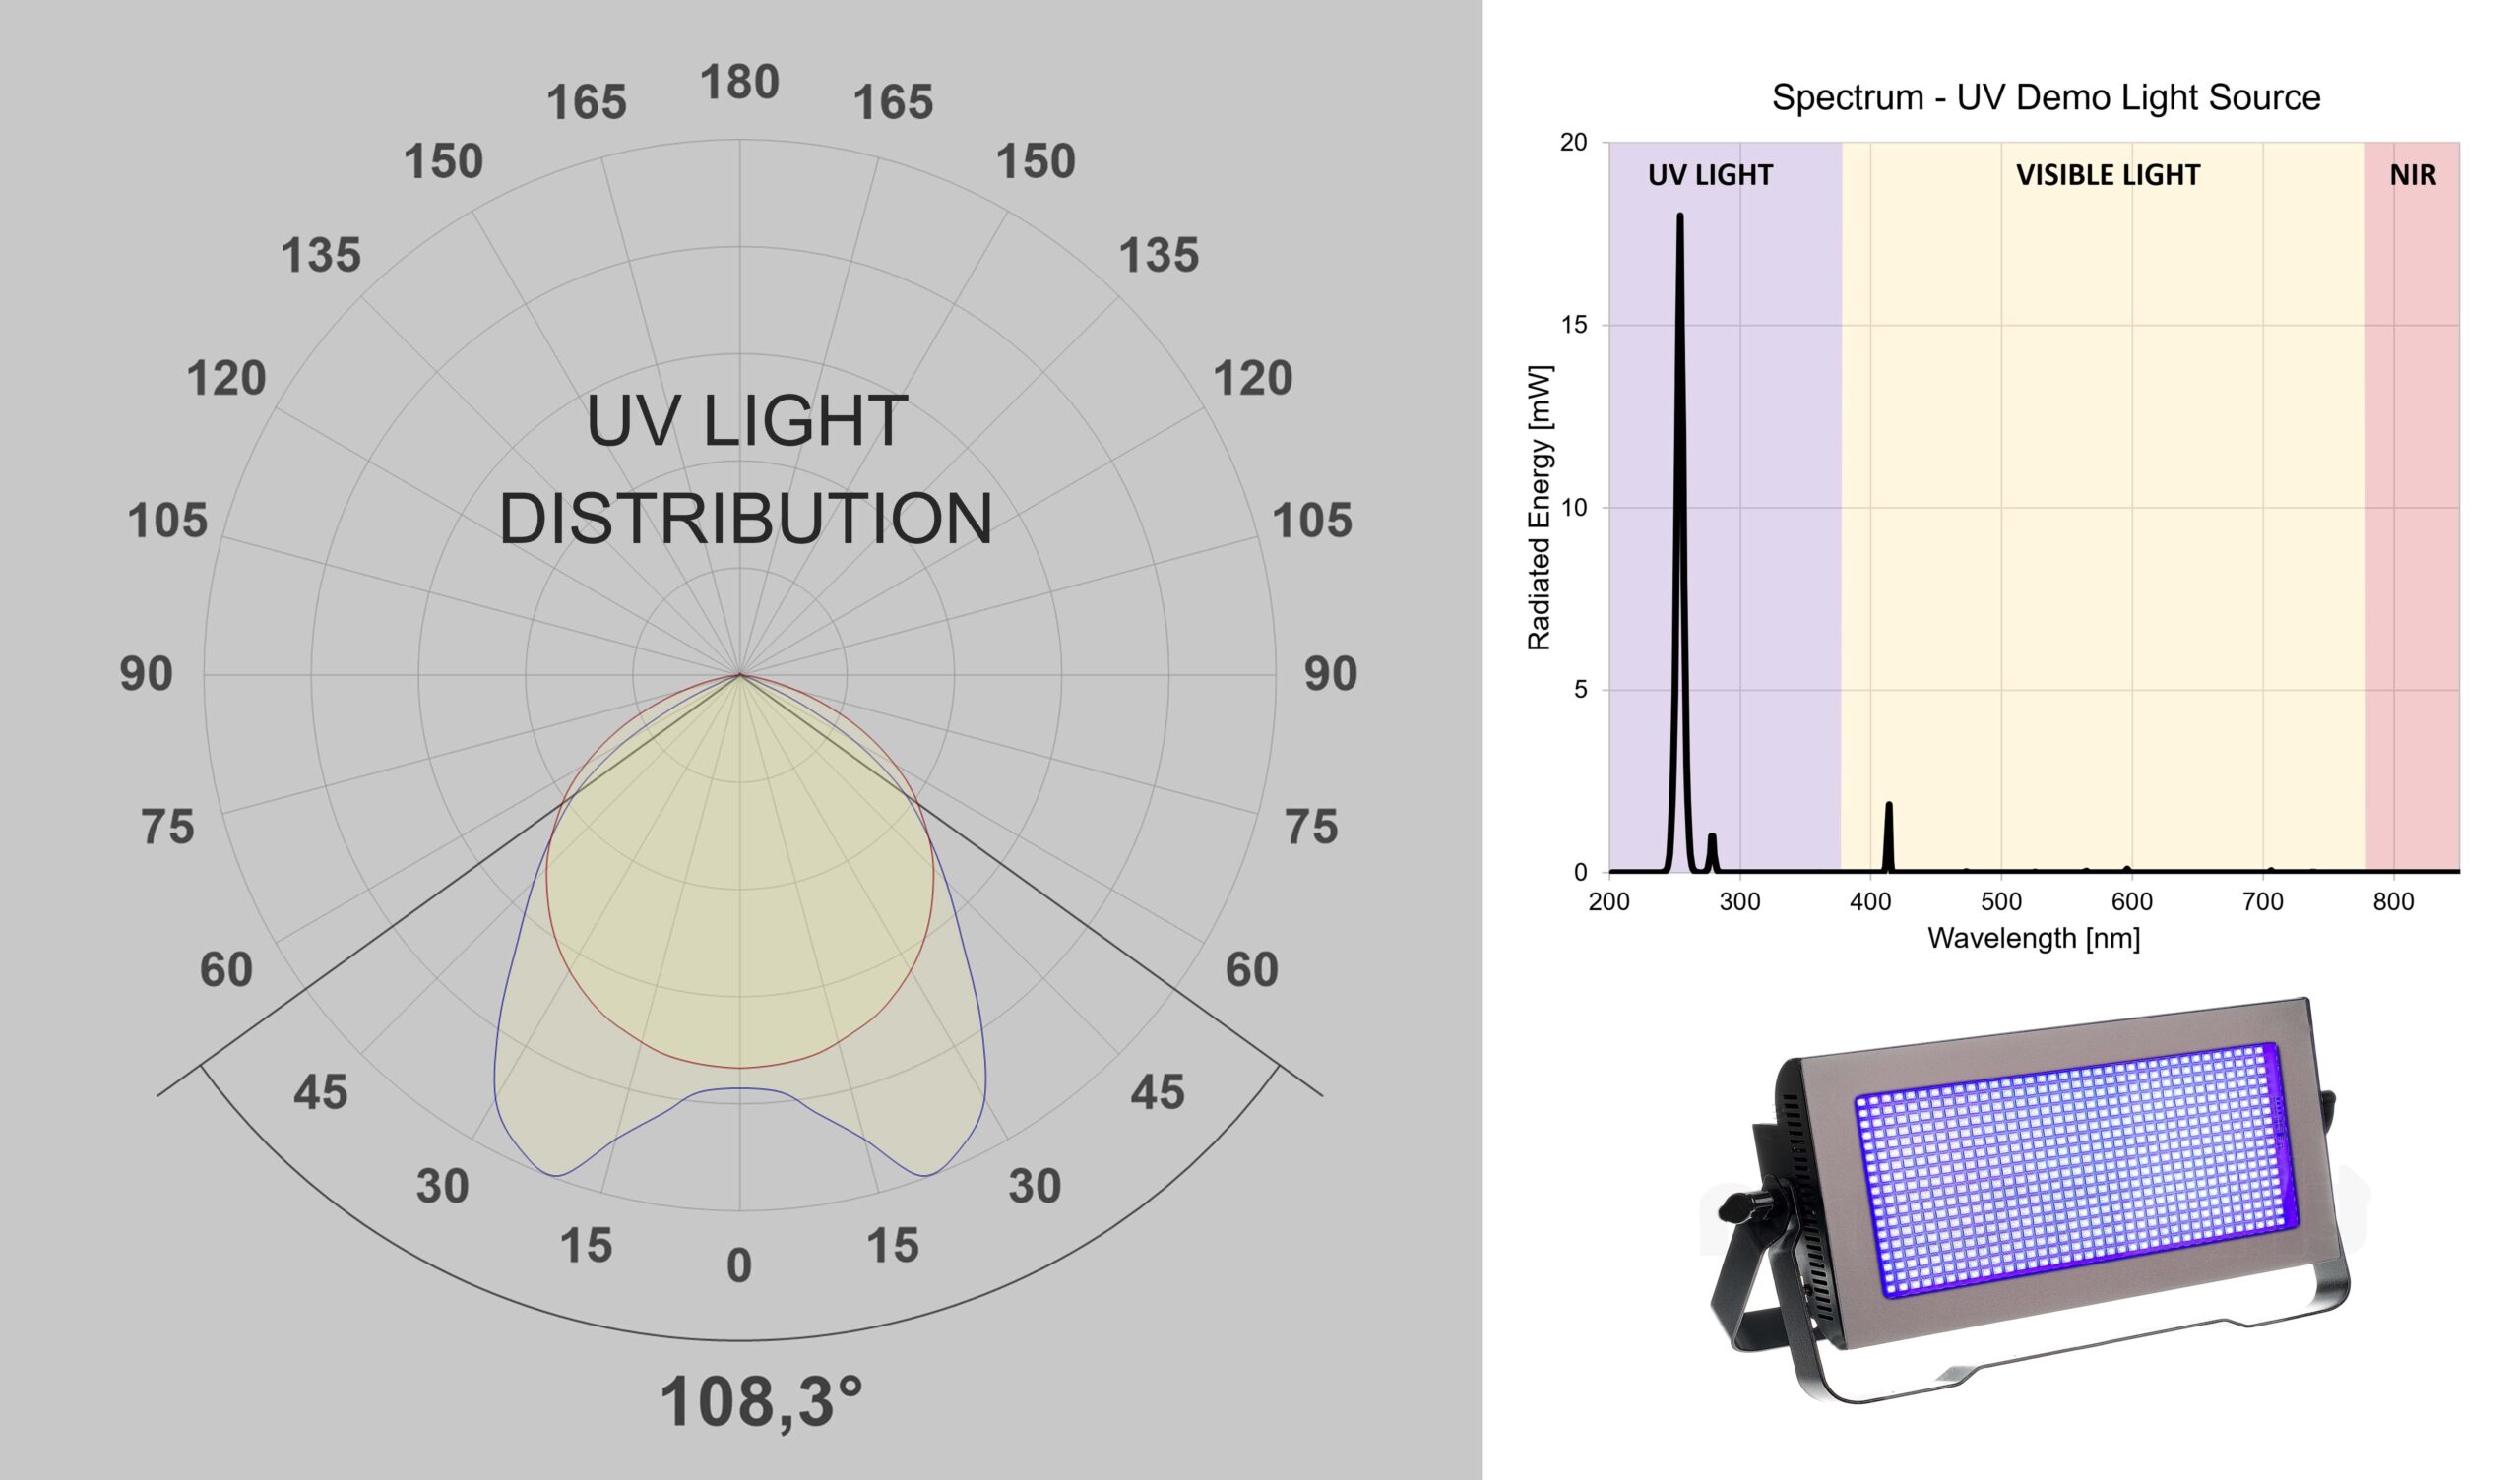
This has recently been demonstrated with commercially available equipment from Viso Systems in Copenhagen, Denmark. A standard goniometer is fitted with a spectrometer sensor (range 200 to 850 nm). An example is shown in Figure 1. This UV light distribution can be exported to .IES and .LDT formats that usually contain photometric results (visible light only).
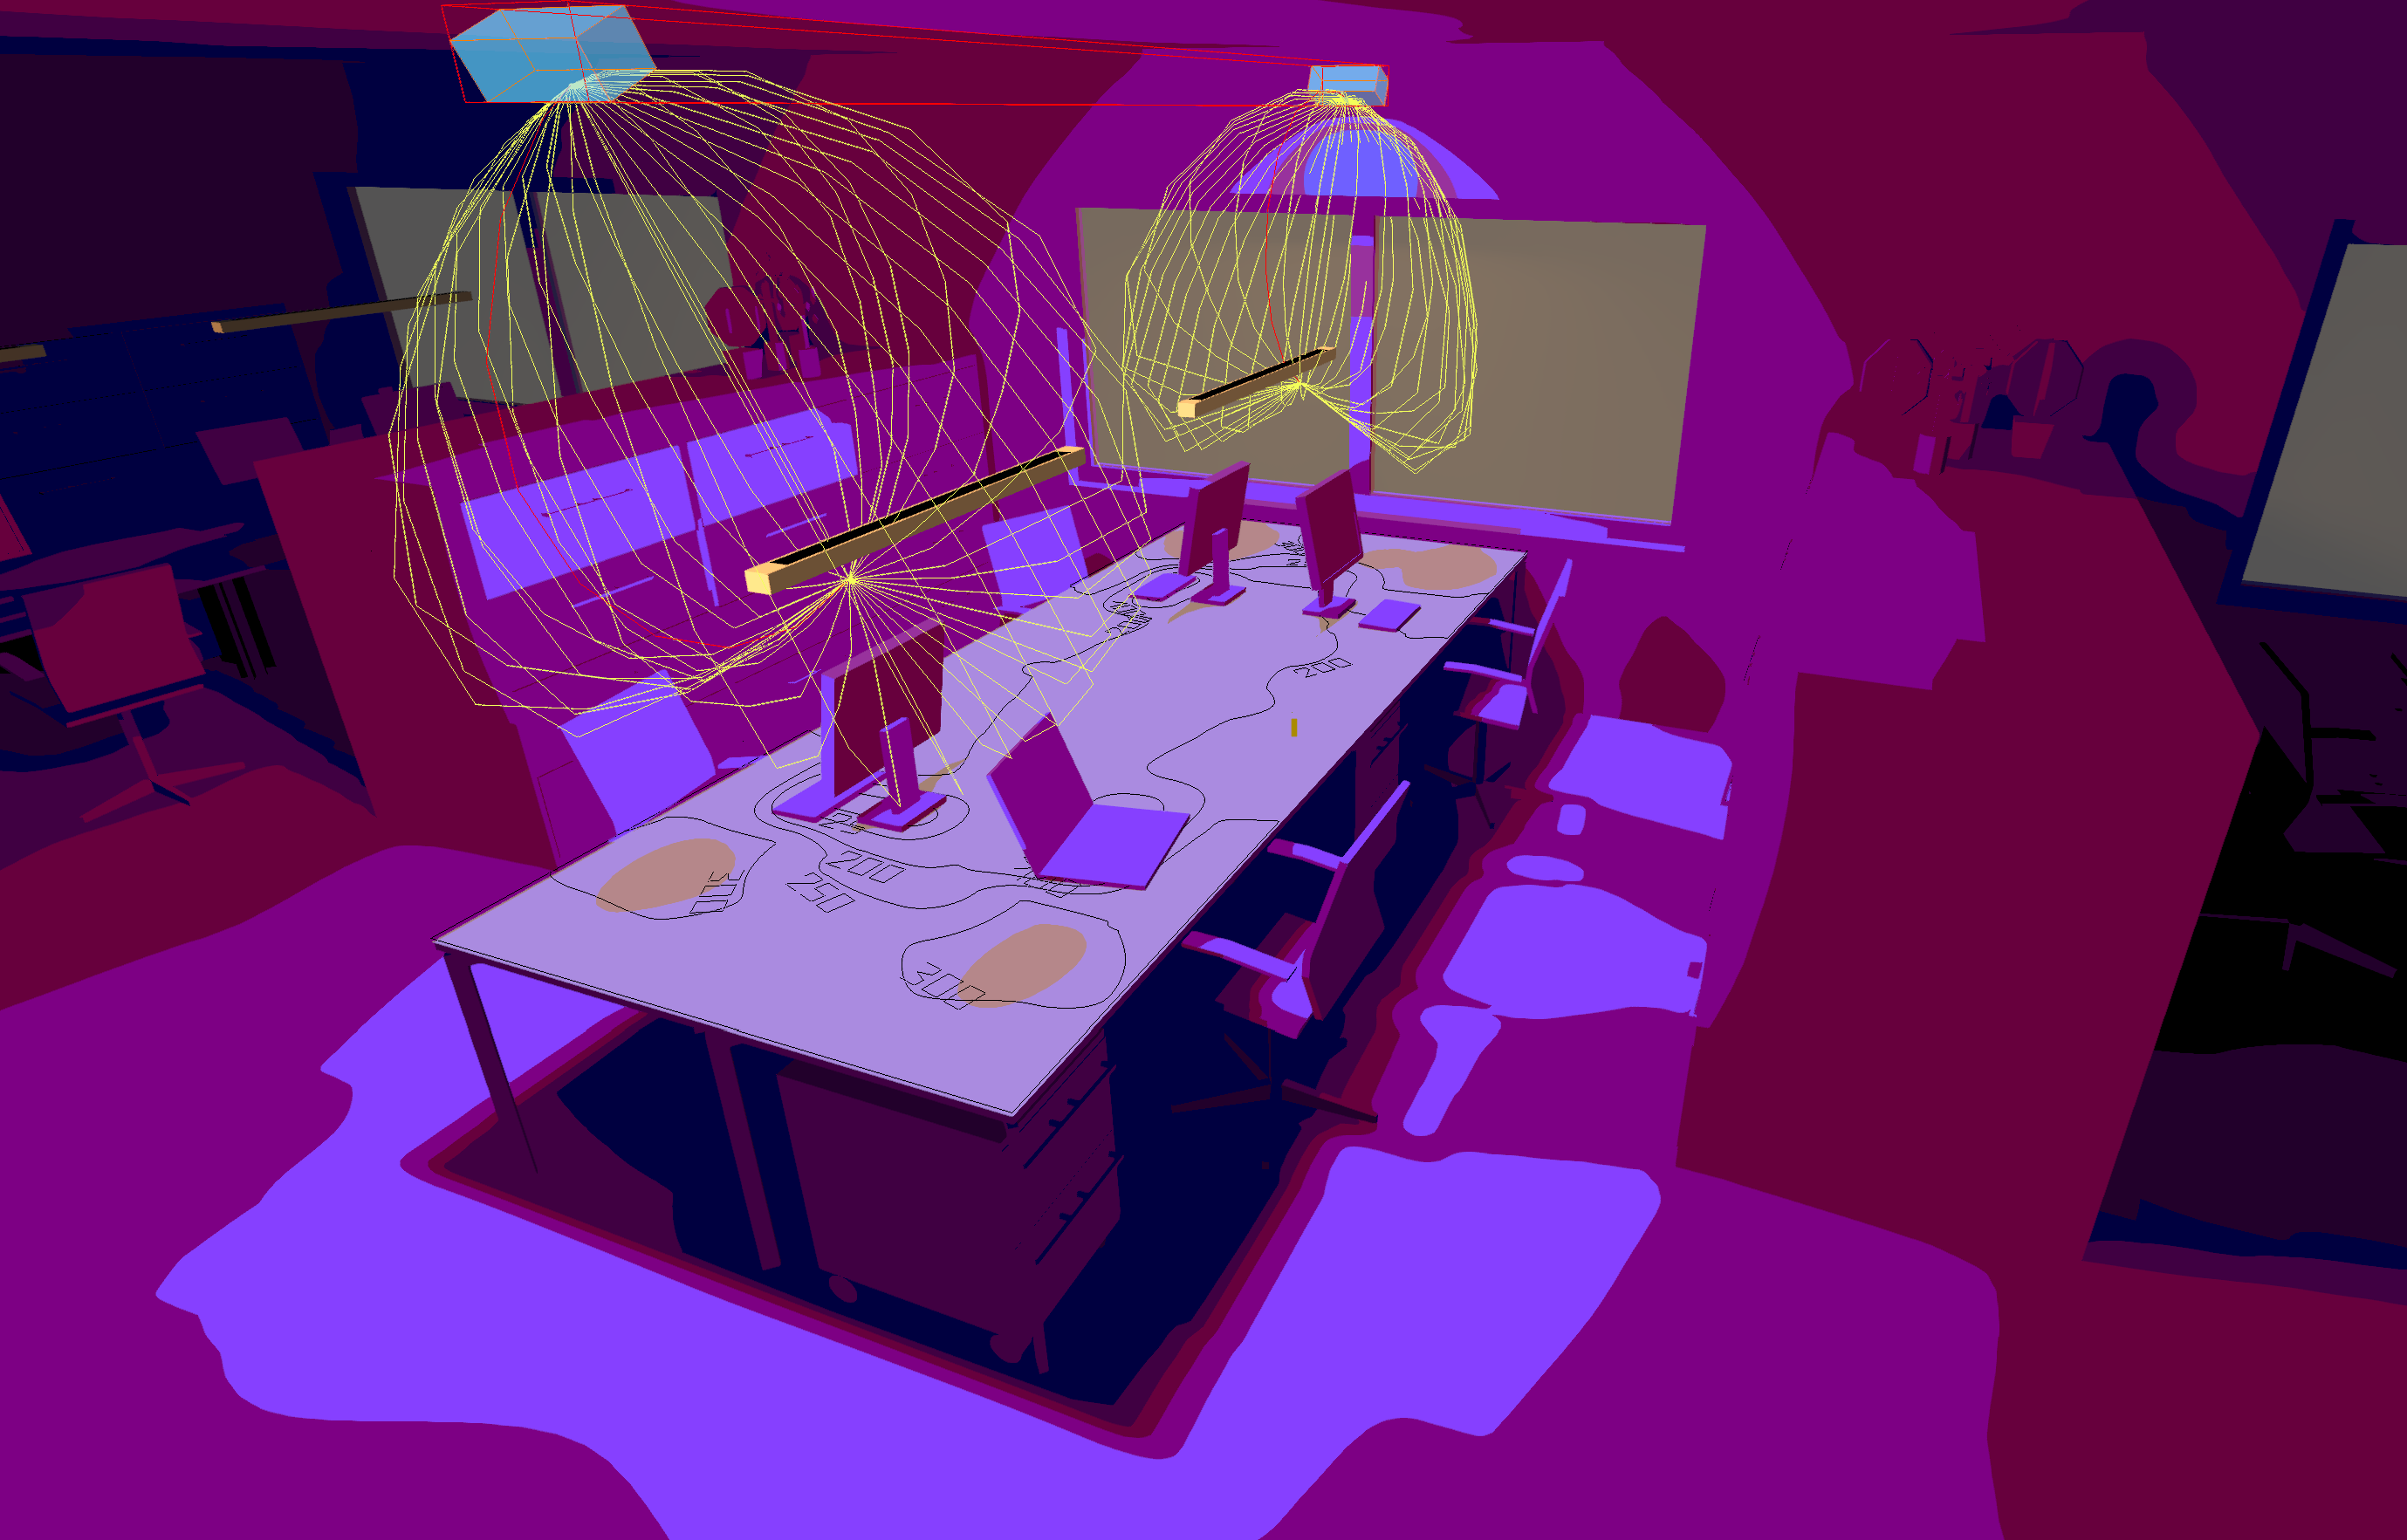
With a UV light distribution file, UV light can be simulated in real spaces like the office space example In Figure 2. The iso-curve values on the desks represent the irradiance (in mW/cm2) generated by the two UV lamps in the ceiling. Hence, it is possible to work with UV irradiance much in the same manner as illuminance in the free lighting design software, DIALux Evo.
With knowledge about inactivation doses for specific bacteria or for viruses such as e.g. COVID-19, this irradiance can easily be converted to exposure time.
“This method is a big step ahead in making germicidal UV applications safer for people and deadlier to germs”, says Viso Systems founder Christian Krause. “This relatively simple way of foreseeing UV distribution in real spaces adds professionalism to the UV business.”
The Danish producer of goniospectrometer solutions recently posted a YouTube video with a step-by-step introduction to the novel UV planning method – see https://youtu.be/A1RbYx-_S-c.
“We hope more producers of UV lighting equipment will go after 3D UV measurement files”, agrees technical sales director Anne Bay and adds: “this business needs to supply credible germicidal predictions to clients – the sooner the better”.
Laboratory light measurement result from a germicidal UV light source. The dominant wavelength is 254 nm. The light distribution curves represent spatial distribution crosswise and lengthwise.
Light planning result with the UV light sources in Figure 1. The iso-curve values on the desks represent the irradiance (in mW/cm2) generated by the two UV lamps in the ceiling. The simulation is done in DIALux Evo 9.2.