DALI controls are particularly popular in large commercial spaces such as offices, shops, and hospitals, where centralized lighting control and energy savings are needed. But what is the actual performance, when dimming and color tuning are implemented?
DALI (Digital Addressable Lighting Interface) is a widely used lighting control technology in construction, especially in commercial buildings and institutions, but is also increasingly used in private homes. It is a digital protocol that enables control of lighting fixtures and allows for flexible and scalable lighting systems.
In practice, it is great to have the same type and maybe even the same model of general lighting installed throughout the building. With DALI it is simple to dim the fixtures to whatever light level is required in a certain area. And the long run also flexible: An office space can be turned into a corridor, and the light adjusted with simple DALI dimming
What happens with the specs?
The problem for both end users and building owners is that nobody knows what the specs are, when you dim and color tune:
- What is the actual energy consumption in the relevant setting?
- Will the fixtures flicker unacceptably?
- What are the color properties when dimmed and/or color tuned?
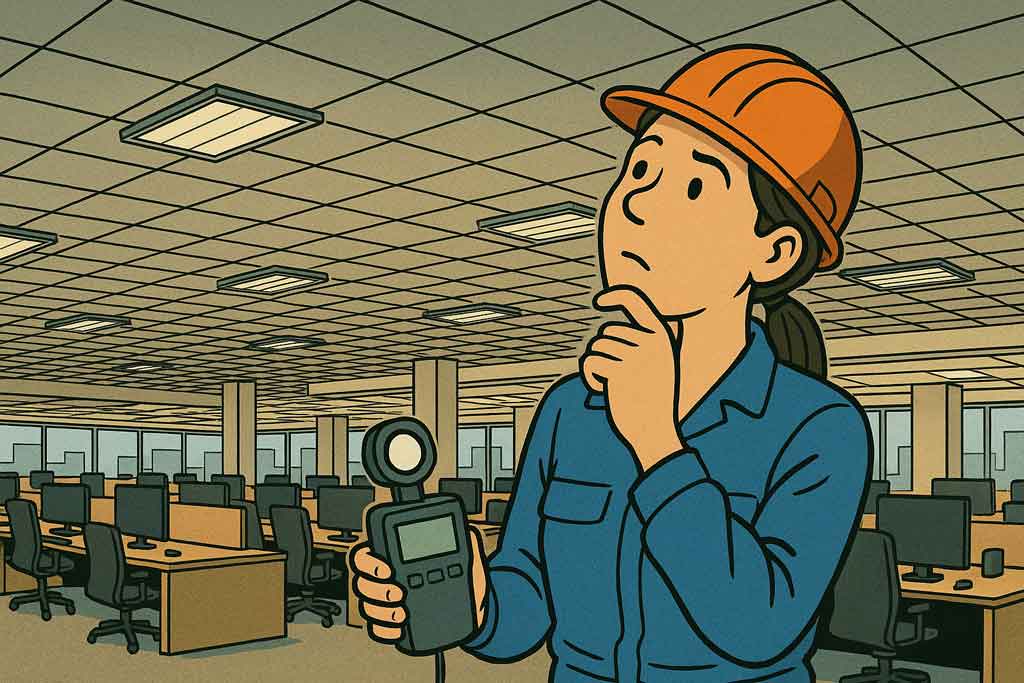
While it is easy to check illuminance with a handheld light meter, answering the above questions is much more difficult. To get an overview, testing must be done in a lighting laboratory, which often requires a full light measurement in every setting. Testing numerous combinations of settings is rarely done because it would require many separate measurements, each of which lasts 20–40 minutes. Therefore, combining just five dimming steps and five color temperatures would result in a testing time of around 15 hours.
A few research studies has demonstrated that some light sources have unexpected/undesired performance as a consequence of dimming or color tuning, e.g. this one and this one)
Installers tell us that luminaires are typically dimmed to 60-80% when installed. When asked about the actual energy consumption, they reply: “Who knows?
Studies generally conclude that many luminaires and lamps perform well, but some definitely need improvement. The problem is that there is no way to know in advance which ones are which. There are no agreed-upon test methods, output data formats, or report templates. As far as we know, standards and building code requirements are also missing (with the possible exception of some building certification systems, such as WELL and DGNB).
Where are the biggest problems?
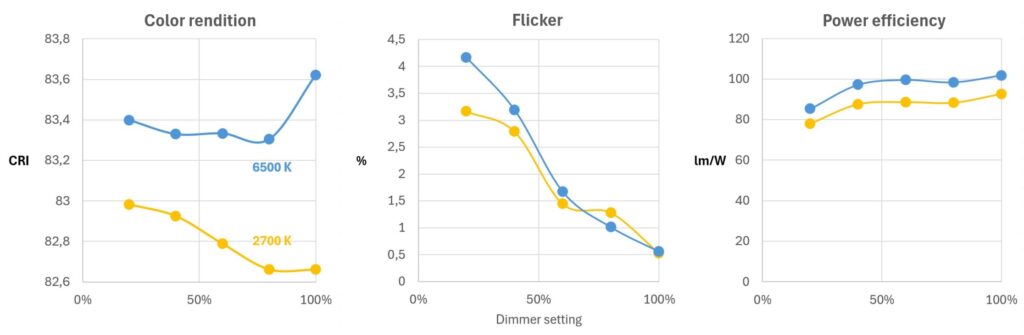
The issues that we see are often related to power efficiency, color properties and flicker.
Effects of Color Tuning – color properties
Then setting the DALI control to produce a specific color, it seldom produces the correct result in terms of CCT. Here is an example:
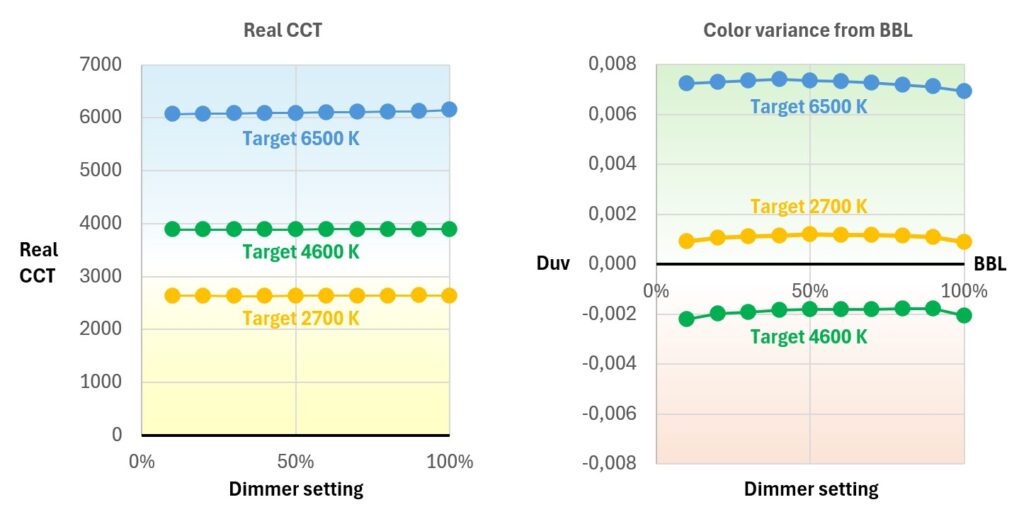
In this “tunable white” luminaire, the color was set to 2700, 4600, and 6500 K, but the result was closer to 2800, 3900, and 6000 K, independent of the dimmer settings.
While settings of 2700 and 4600 K provided color coordinates close to the blackbody locus (BBL), the setting of 6500 K provided a Duv of about 0.007, which is a visible greenish tint (0.002 is considered noticeable).
So, the color settings are really not reproduced very well.
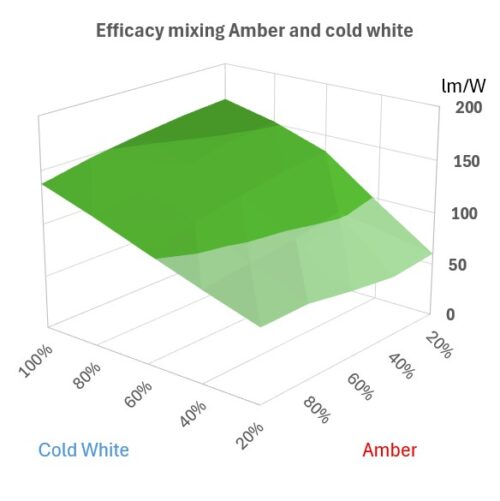
Effects of Color Tuning – efficacy
A more obvious result of color tuning and dimming is loss of efficacy. In the example below, the lumen-per-watt value is almost 3 times higher in the most efficient setting than in the lower point. This is a result of the internal LED driver loss becoming a more prominent part of the power consumption. The problem arises when engineers presume that dimming down to 50% will also save 50% power. In the example below, only 25% power is saved.
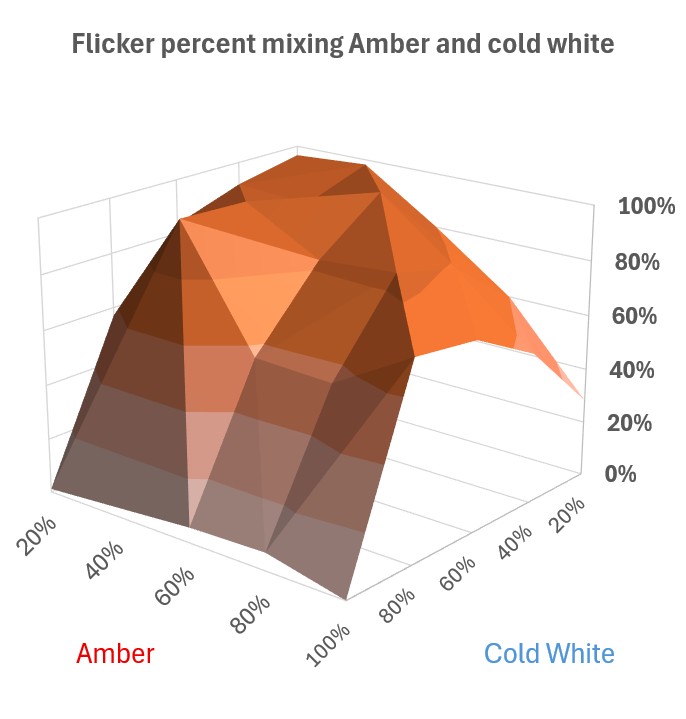
Effects of Color Tuning – flicker
Color tuning in the sense ‘adjusting the color temperature (CCT) in a preset range (defined by the coldest and warmest LEDs on the PCB) involves dimming both sets of white LEDs to make a mixed output with an intermediate CCT. PWM-dimming is popular and introduces totally new TLA features – and two combined TLA waveforms can even produces dramatic interference effects. See the example below.
Consequently, TLA can be much worse between color endpoints.
What should be done?
The above measurements were performed automatically in all settings with the following equipment in a dark room laboratory:
Viso LabSpion goniospectroradiometer. It is a type-C goniometer system fitted with a spectrometer sensor.
Viso LabFlicker. This unit measures flicker (all contemporary metrics) in the lab and on site.
Viso LightInterface. It makes it possible to control light sources during measurements (DALI/DMX/1-01V).
Results have been captured with Viso Light Inspector software and exported for further analysis. Since this analysis is performed automatically, it only takes one or two hours, depending on the granularity and stabilization between settings.
New data formats needed
But how to tell this story? IES files contains no color information and can only contain the output of one control setting. The European LDT file is slightly smarter: Can contain general color information (CCT and CRI, but not e.g. TM30Rf, Duv or SDCM) and can do so for multiple light sources within the same luminaire – which can be tweeked to contain regulated outputs as the above. None of these formats contain flicker/TLA information.
So, here’s a shout-out to the standardization bodies. Please create a standard output format that makes sense in the world of regulated lighting.