Viso Light Inspector® is the most intuitive light measurement software on the market. This goniospectrometer interface and PC software system is included in all Viso light measurement products. All measurement data is displayed in real time. Photometric results are displayed graphically and give you a quick overview.
Several language versions are available: English, German, Spanish, French, Italian, Japanese, Portuguese, Russian, Simplified Chinese and Danish.
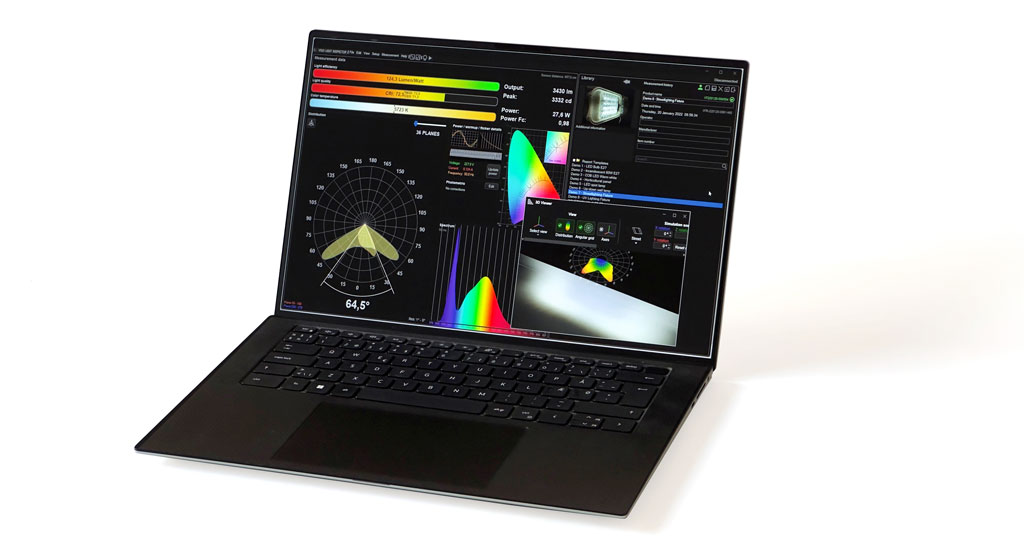
All processes are intuitive, and the Light Inspector guides you through both measurements and calibrations step by step.
Measurements are fast: A double C-plane measurement (one sweep) in 5-degree resolution typically takes 15 seconds. The Light Inspector even collects data from accessories such as external power supplies, LabFlicker and LabTemp and adds them to the same measurement file. C omprehensive LDT and IES simulation files are standard outputs.
WEBINAR – light measurement software
This webinar showcases the Viso system with the Light Inspector software. All light measurement software functions are displayed step by step
Reporting: Customize your reports directly
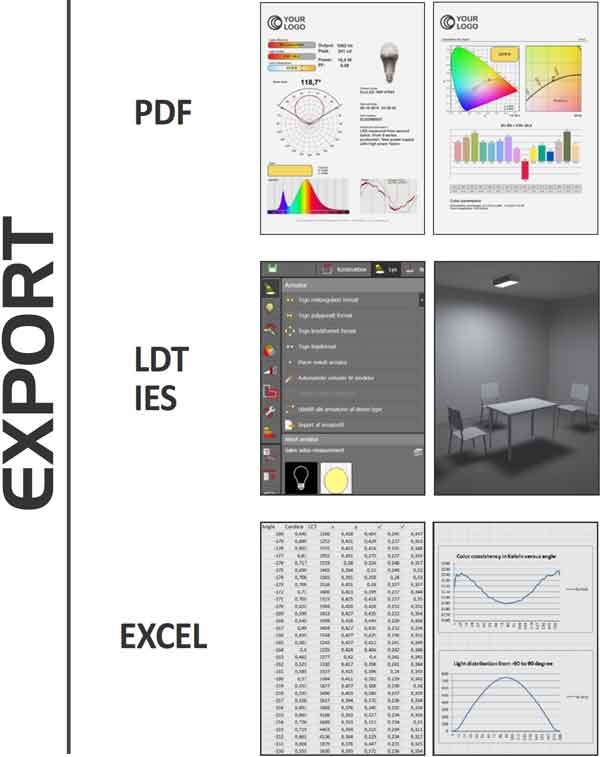
The Light Inspector software supports custom design of PDF reports. This powerful feature allows you to display exactly the data that is important for your products and fully customize your report design to your company’s identity. Microsoft Word is the only editor needed to create your own report templates.
Light Inspector is the first light measurement software that gives you full control over your reporting. This simplifies workflow: data sheets can go directly from the lab to your website without the need for design assistance.
TRACKING: KEEP YOUR MEASUREMENTS SAFE
You can choose to “Track and Trace” your measurements with Viso’s unique feature that stores all details on the Viso Systems tracking server with a unique number. It is then possible to share and verify data simply by sharing the tracking number. In this way, anyone with the tracking number can access the Viso Systems tracking site and verify measurement data, any adjustments, time and location.
Advantages
User-friendly graphical interface
Automatic goniometer setup
Graphical power analyzer
Real-time measurement data
Detailed angular distribution
Add product image and description
Customize pdf reports using Viso report designer
Many language versions: English, German, Spanish, French, Italian, Japanese, Portuguese, Russian and simplified Chinese
Connect directly to MATLAB , LabVIEW, etc.
Compatible with Windows 7, 8, 10, and 11
Downloads
Get more information
The most important features and outputs
The features below are all out-of-the-box features included in Light Inspector
Basic features
Measurement tools
Photometry
Spectrometry
Reporting and export
Advanced features
Measurement tools
Radiometry
Spectrometry
Analysis tools
Reporting and export
- requires special sensors or accessoires
One click starts the fully automatic setup and the measurement cycle
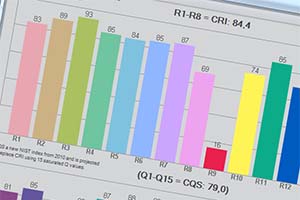
Comprehensive color quality data results, including CRI, CQS and TM30 values
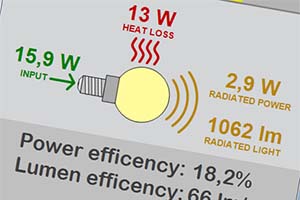
Power efficiency can be calculated using the radiated spectral energy
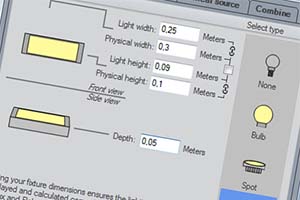
Easily add dimensions to your light sources and luminous areas

