Measuring UV Light for disinfection (UVGI – UV Germicidal Irradiation) can be more difficult than visual light. There are more parameters and risks. It is difficult to compare solutions.
Viso takes the consequence and gives you the opportunity to work with UV measurement solutions on a professional level – but without the complexity.
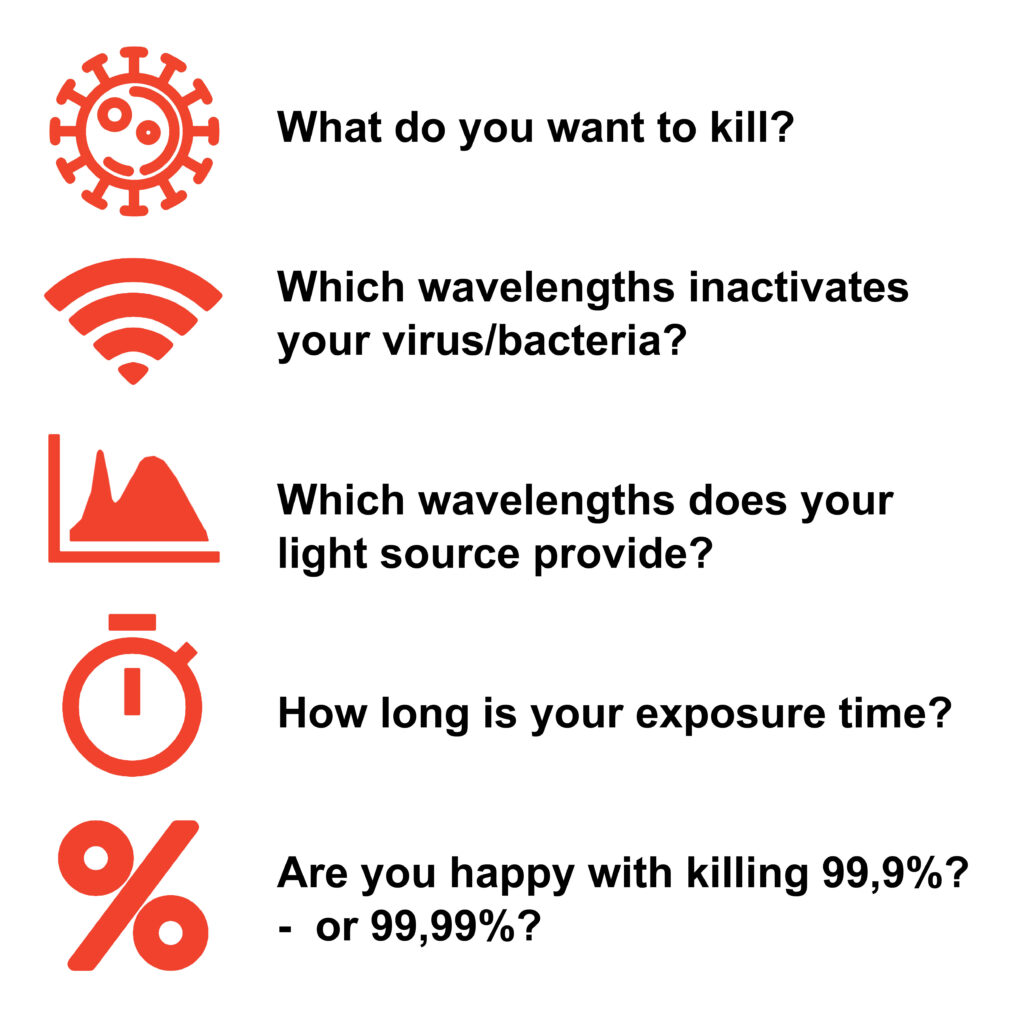
The questions above are some of the thoughts that may go through your head when trying to explain exactly how powerful UV disinfection might be. In general lighting it is easy: An iso-lux diagram is a good way to illustrate how much lighting you will actually achieve with a given light source.
In the world of UV disfection and other UV applications, the parallel to iso-lux diagram would be iso-Watt diagrams. But such a diagram would not take into account what bacteria or virus that you want to kill or its sensitivity to particular wavelengths. Also, you would not get any help on which exposure time to recommend. See how Viso has made this much simpler to work with and illustrate.
UV measurement video introduction
New features
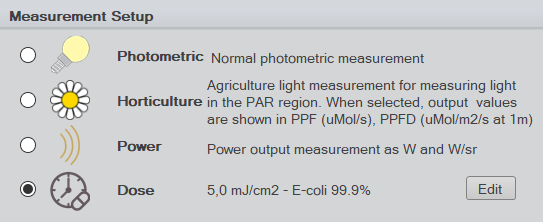
Pick your UV measurement style
Now it is possible to simply select the required dose value and the exposure times are automatically calculated.
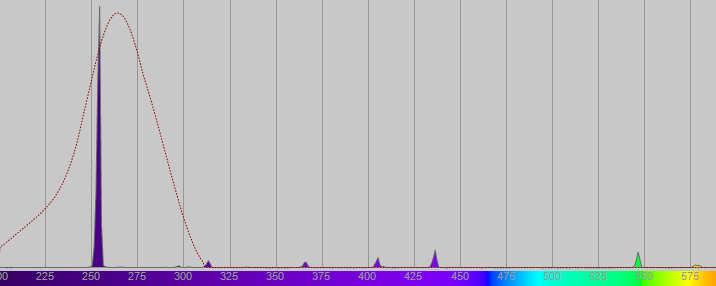
Add any spectral response curve to your UV measurement
You can now add any desired response curve for example a standard germicidal curve. The software displays the measured spectrum overlayed with response curve.
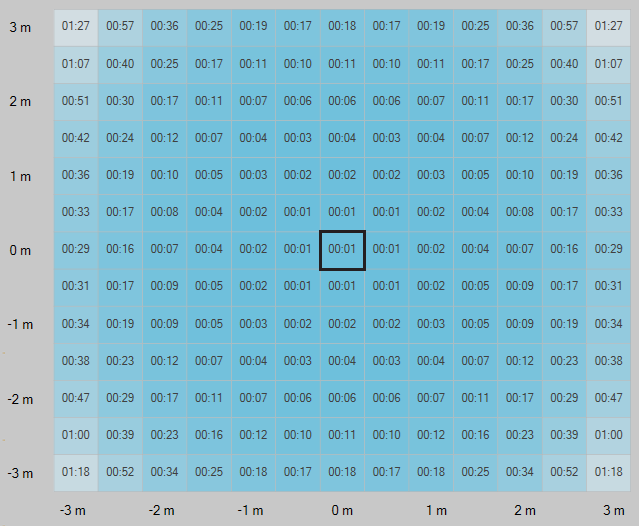
This chart makes it easy for your salespeople to explain your product to clients
Pick a dosing distance and see your dosing scenario as exposure time (hour:min) on a plane.