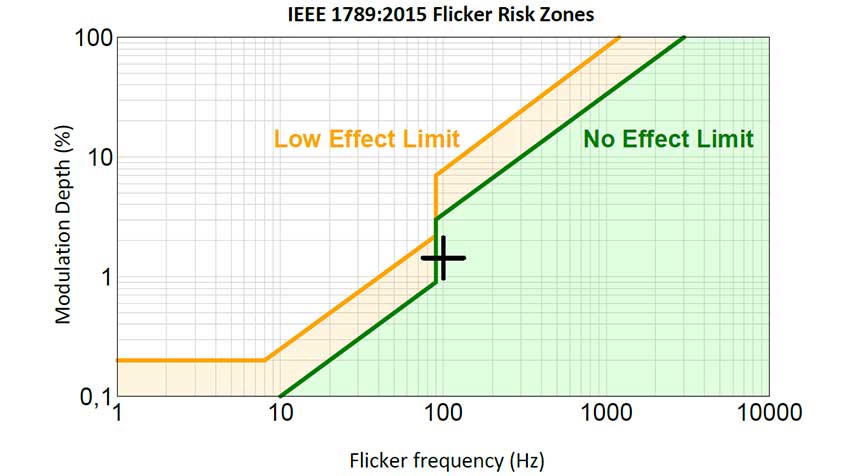
The IEEE 1789 standard* has long been the go-to standard for flicker evaluation and estimating effects on humans. Although more advanced evaluation systems have been introduced (like PstLm and SVM), the IEEE 1789 graphical presentation of flicker modulation depth vs frequency remains an important indicator. It presents a first-glance impression of flicker severity, which is why the IEEE 1789 diagram has now been added (with Light Inspector software version 6.61) to the standard graphical element for PDF reports.
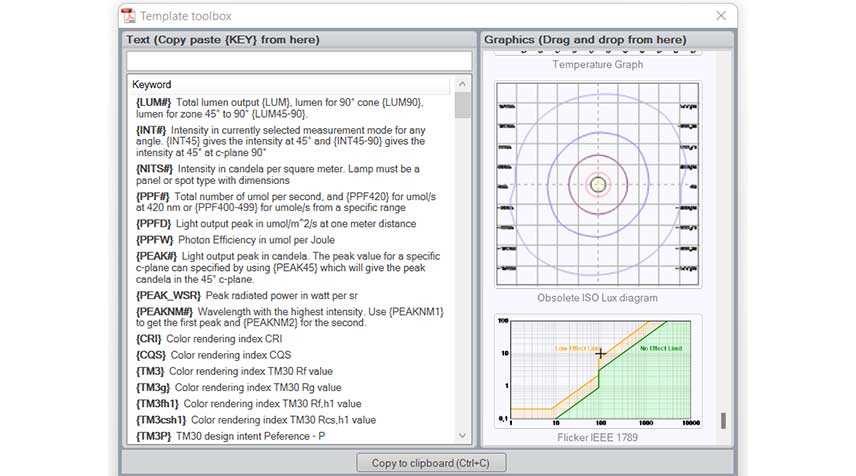
To add the graph, simply drag and drop the IEEE graph from the PDF Template Toolbox to your report (open in MS Word).
You can measure flicker in your products with Viso LabFlicker.