Measuring LED and other LIGHT SOURCES
Data sheets for LED components (SMD, COB) includes lots of information about the emitted light. Goniometers from Viso Systems capture all information when measuring LED and other light sources. The Viso Light Inspector software is the strongest and most intuitive light measurement software solution in the market. For instance, the user-friendly dashboard provides you with a perfect overview of your measurements – and in real-time. The software handles automatic goniometer setup and measurement. Furthermore, the Light Inspector has extensive output options and connect directly to MATLAB, LabVIEW, etc.
GETTING your own lab
The Viso BaseSpion system is especially well suited to measurement of RGB LEDs, COB LEDs and SMD LEDs. Fast spectrometer sensors is the technology behind all Viso light measurement systems. Hence, all data is based on full-spectrum goniometer measurements. In addition, measuring is fast: One full plane (= two C-planes) in a 5° resolution is measured in just 20 seconds. As all data is generated by the Viso system, there is no need for subsequent integrating sphere measurements.
The portable LightSpion is an excellent choice for measuring LED components as well as round-symmetrical small light sources such as household light bulbs.
Your business
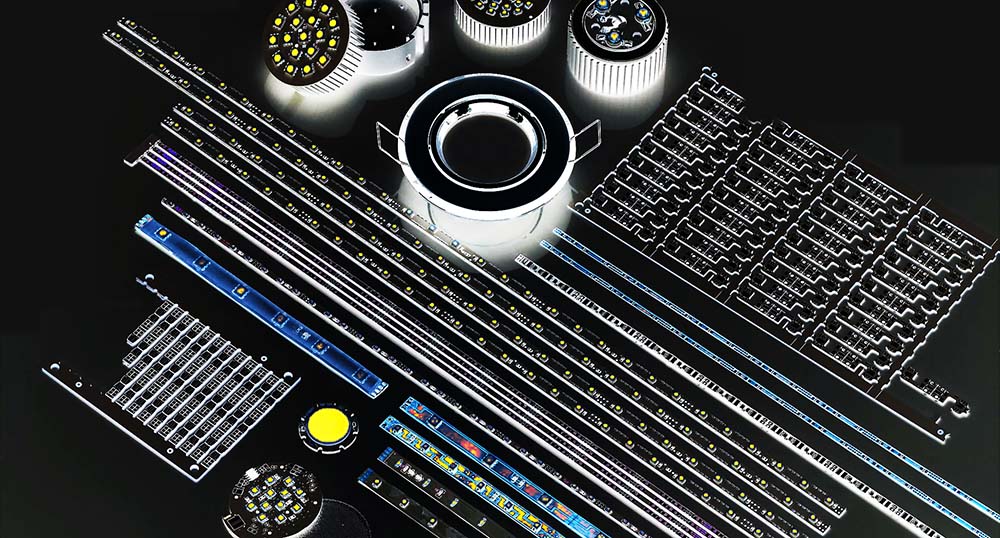
LED components and modules
COB (Chip-on-board) solutions
LED strips
Household light sources
Conventional light sources
VISO SYSTEMS FOR YOUR LAB
Get more information
Measuring LED: Basic outputs
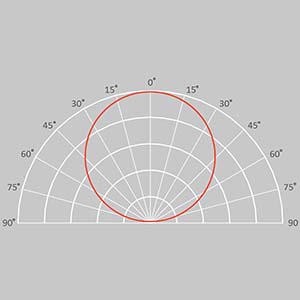
Light distribution curve
Measuring LED in great detail is no problem. With up to 72 C-planes and up to 0,1 degree gamma resolution, there is data in abundance to plot. 3D plots are included as well
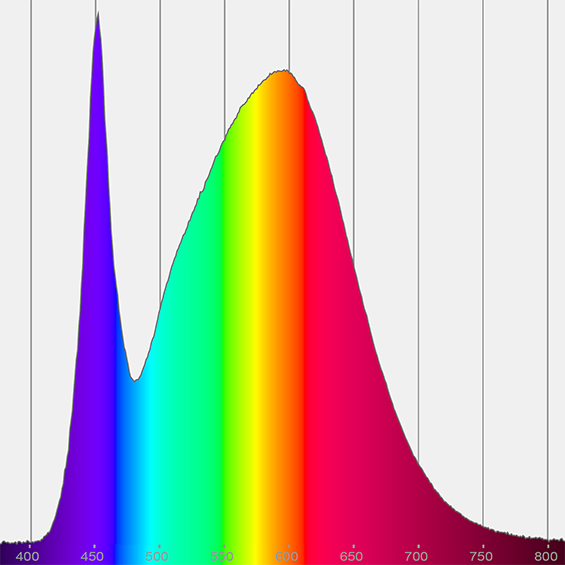
Spectrum
As light is detected with a Viso fast spectrometer sensor, spectral data is recorded in every measurement. A Viso goniometer will even provide ‘color over angle’ data (not possible with an integrating sphere)
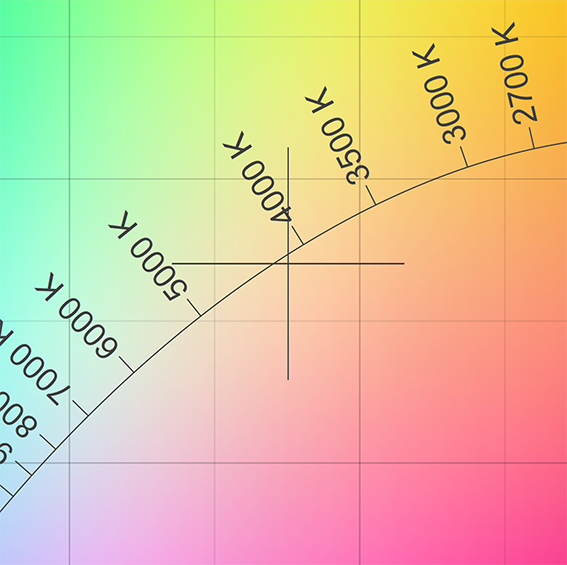
CIE 1931 color coordinate plot
The integrated spectrum can be plotted in a CIE 1931 x,y-diagram. Provide your color target, and the color difference (Duv) and the SDCM value (MacAdam steps) are prompted
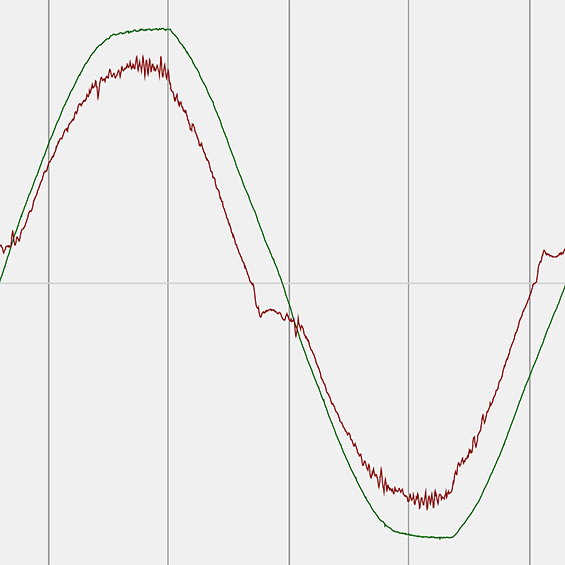
Power characteristics
All Viso goniometers have a built-in power analyzer. The analyzer will help you to determine when light sources are stabilized. Important power data (wattage, efficacy, power factor etc.) are standard
Further outputs
Fundamental radiation data
Color and color deviation data
Lighting design and data export
Power and warm-up data
Popular additions
Add great tools to your system, capture more data and ease your work
The LabFlicker instrument records all contemporary TLAs (temporal light artifacts): Flicker and stroboscopic effects including PstLM. LabFlicker connects to all Viso systems
Add a LabTemp 3-port temperature probe system for monitoring ambient lab temperature and 3 temperature spots
Upgrade your existing sensor to provide a broader measurement range (e.g. UV) or a wider sensitivity ranges