New software feature shows the peak intensity plane
In many asymmetrical light distribution measurements, it is interesting to know the direction of the peak light intensity. This is the case in street lighting. With software version 6.16, we introduced a new feature: “Show peak plane”.
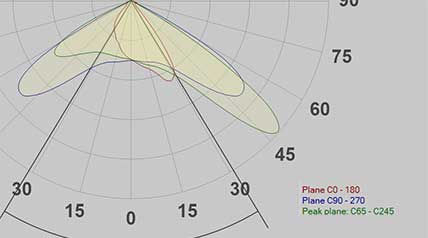
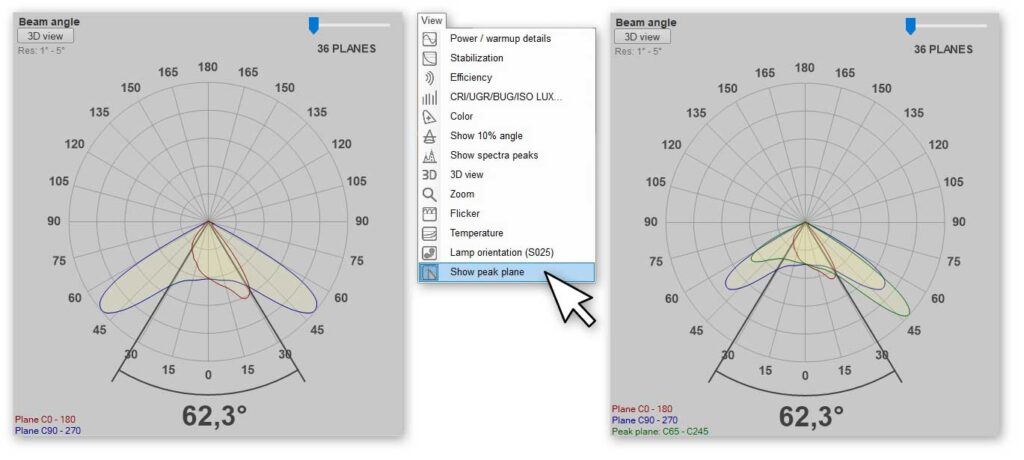
In the polar diagram of the Light Inspector dashboard, you will normally just see measuring plane C0-C180 (in red) and measuring plane C90-C270 (in blue). But by choosing “View” and then “Show Peak Plane”, another plane will appear (in green). At the same time, the polar diagram rescales so that the outer ring represents the peak value = 100%. This is the C-plane that contains the measured peak intensity [cd] and its opposite C-plane. In the legend in the lower left-hand hand corner, you will find an indication of the specific peak plane.
Peak planes in PDF reports
It is possible to visualize the peak plane in exported PDF reports as well:
- Open your PDF template in MS Word (an .rft file)
- Go to the relevant polar plot/angular distribution graph
- Make sure your plot is wrapped in the text either as “Floating” or “Inline”
- Right-click on the plot
- Pick “Alt Text” from the menu
- Add the command “SHOWPEAKPLANE” to the Alt Text.
- Close and save the .rft file
Your report should now include the peak plane.
For your legend, use {PEAKPLANETEXT}. Then, the report will generate a text as e.g., “Peak plane C45 – C225”
Another PDF report keyword
We also changed the PDF report keyword {PEAK} slightly:
- Write {PEAK} if you need the report to show the overall intensity peak value [cd] for the whole light distribution
- Write {PEAK#} (# being s specific C-plane angle) if you need the maximum intensity in a specific C-plane
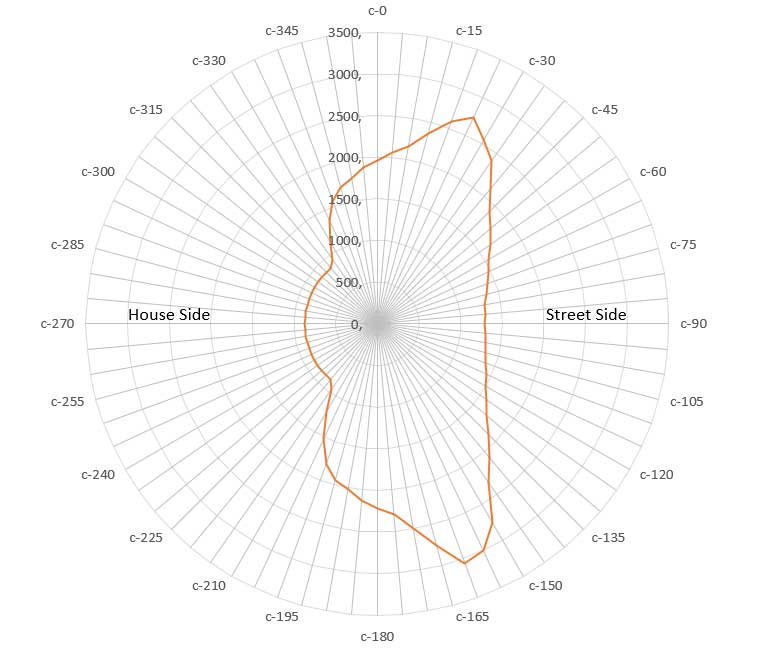
- By adding {PEAK#} for all C-planes to an embedded Excel sheet, you can even plot the maximum intensities in a special diagram like this: