Regional and number options are now available. New report template explorer with multi-report and multi-fixture export capabilities. Added new 3D viewer heatmap data sources and ability to export view as image. Added multiple keywords. Various bug fixes.
Regional and number format settings
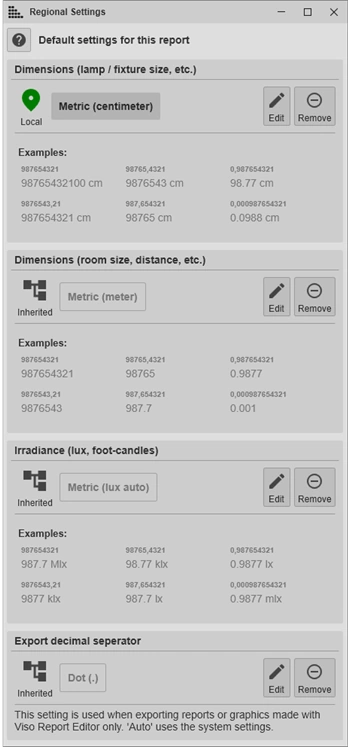
A major addition in version 7.51, especially for the non-metric folks out there, is the ability to change regional settings in LightInspector. This allows you to use imperial units throughout the software, or to display for example every fixture dimension in millimeters.
There are three metrics for which you can change the settings: Dimensions for the lamp/fixture, real-world dimensions like the room sizes, measurement distance etc., and irradiance, which can be in lux or foot-candles.
You can also change whether the exported reports should use dot or comma as the decimal separator.
You can change these settings on multiple levels, and settings are inherited, meaning that you can always override a setting on a lower level.
There are five levels of regional settings:
Keyword/Graphic – On relevant keywords and graphics, you can configure the settings by right-clicking and selecting ‘Properties’.
Default – this is the default for LightInspector and is not user configurable.
Application (Setup->Options->Region) – this is your application-wide level. Unless the settings configured here are overwritten on a lower level, these will apply in both your UI and in your reports.
Export (File->Export->Pdf->Settings) – These settings apply for all exported reports. This is useful if you for example want to export a handful of the same reports in metric and imperial units, without modifying the .vrep report templates.
Report (Report builder->File->Regional settings) – These settings only apply for the .vrep report template they’re set in.
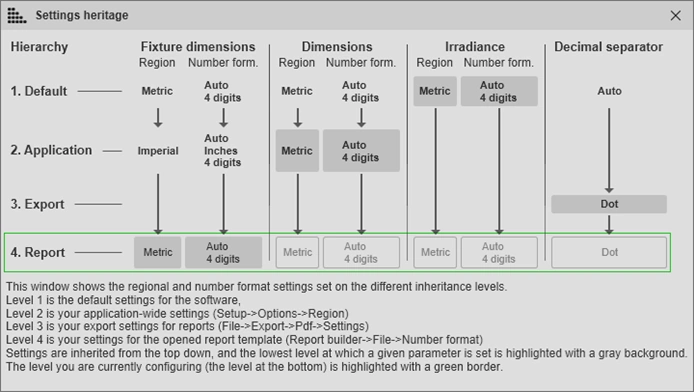
Four of the levels are visible in the ‘Settings heritage window’ which you can find by clicking the ‘?’ button in the top of the regional settings window, or by hovering over the Local/Inherited indicator to the left of each of the settings. In the heritage window, you can see what settings are set at which levels, and whether these are the settings that apply at the level you’re currently on. The settings highlighted with a grey background are the settings which apply at the level you’re on, which is the one in the green border. In the example, you can for example see that the fixture dimension unit is set to imperial inches on the application level, but metric in the report, meaning that the default for the report is metric.
Report template explorer
In the new browser, you can also select multiple templates and folders (ctrl + click to select multiple, or shift + click to select range) to export more than one report at once.
You can also select multiple measurements in the main window, to export all the selected templates for all selected measurements. This will create folders with the names of the measurements with all your selected reports in them
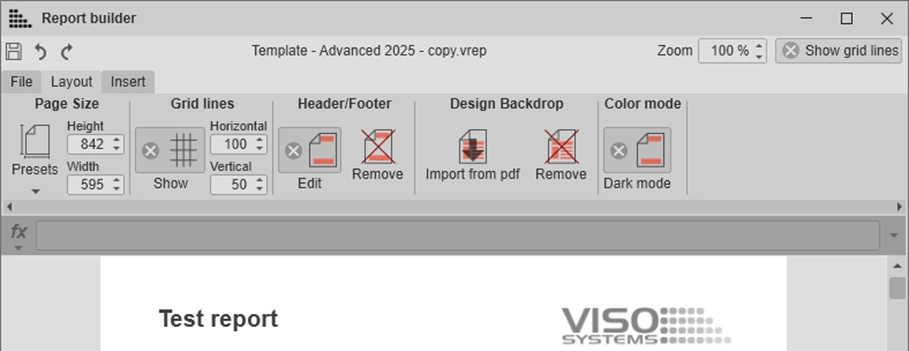
The report editor and the ‘.vrep’ format
In case you missed it, we have, in a previous release, introduced the new Viso Report (.vrep) template format. The new format, along with the editor, allows you to create reports directly in LightInspector without the need for third-party software. You can do things like add all the familiar measurement graphics, do calculations in tables, and embed Excel or Libre office sheets.
New in version 7.50 is the ability to change and show the units of many keywords and graphics, including unit prefixes and whether you want feet or inches for imperial units. Just right-click the keyword or graphic and click ‘Properties’. See the ‘Regional settings’ section for more info.
Also new is the ‘Design Backdrop’ feature. This allows you to create reports with a pdf as the bottom layer of your report. With this, you can use your existing design and only populate the measurement graphics and numbers from the selected measurement. This is a great option if you want more complex design options than those which are available in the editor. You can also add the design backdrop onto already existing reports.
3D viewer
Heatmap mode and data sources
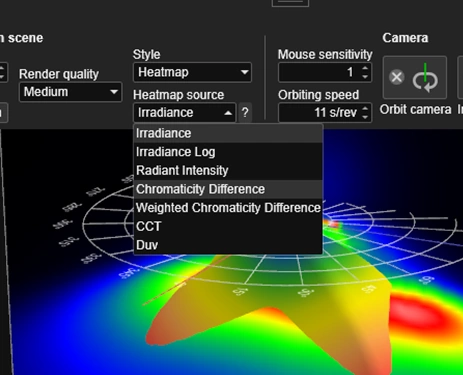
You can now view the simulation scenes as heatmaps with different data sources. With this new feature, you can easily examine the angular color consistency, illuminance, and intensity of your light source directly in the 3D viewer. You can hover over the ‘?’ next to the drop-down to get more info about each of the visualization modes
Exporting the 3D view
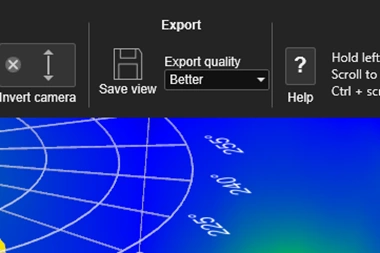
You can now export your 3D view as .png, .jpeg, and .bmp. It will export the exact view you have in the 3D viewer at the selected setting. You can select different export qualities based on the desired resolution of your rendered image. Exporting at the ‘Best’ setting takes some time to render, depending on your computer’s capabilities. The exported images have transparent backgrounds.
New keywords
Color Consistency Index {CCI_ILLUM}, {CCI_INT}. Propriety index to describe color uniformity. Outputs one standard deviation of u’v’ coordinates weighted by the intensity or illuminance. Values lower than 10 % of max are excluded from calculation.
Full-Width Percentage of Max {FWPM}. Similar to full-width half max, this keyword allows you to input an arbitrary percentage value in order to get the beam width between an intensity threshold.
Width, Length, and Height {WIDTH}, {HEIGHT}, {LENGTH}. Keywords for the luminous surface dimensions without fixed units enabling it to be set in the regional options.
Lamp Width, Length, and Height {WIDTH_LMP}, {HEIGHT_LMP }, {LENGTH_LMP }. Keywords for the luminaire dimensions without fixed units enabling it to be set in the regional options.
Irradiance {IRR_M} and {IRR_F}. Irradiance with distance to lamp specified in meters and feet respectively. Use regional options to specify if the output should be in lux or foot-candles.
Flux {FLUX}. Radiant flux without locked output format e.g. lumen. The output unit will change with the setting for the measurement.
Flux up and down {FLUX_DOWN} and {FLUX_UP}. Radiant flux in the upper and lower hemispheres without locked output format e.g. lumen. The output unit will change with the setting for the measurement.
Efficiency / Efficacy {EFFC}. Efficiency without locked output format. The output unit will change with the setting for the measurement e.g. lm/W for photometric measurement and W/W for radiometric.
External Quantum Efficiency {EQE}. Gives you the external quantum efficiency in percent. This is only relevant for individual light sources or comparisons. Current must be measured through the light emitter.
UGR 4H 8H {UGR_4H8HL} and {UGR_4H8HC}. UGR value for 4H 8H lengthwise and crosswise respectively.
New report graphics
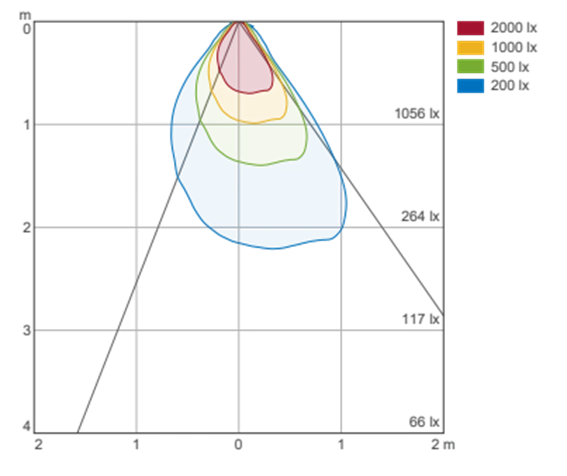
Illuminance diagram
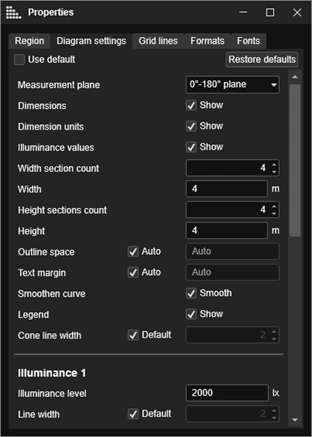
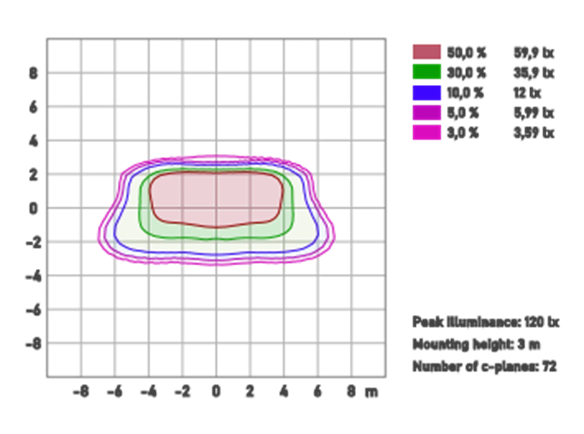
The new vertical illuminance diagram shows the distances at which different lux values are achieved. There are many properties which can be set by right clicking the graphic and selecting ‘Properties’.
Graphics with new properties
Right-click these templates in the vrep report editor and click properties to edit them.
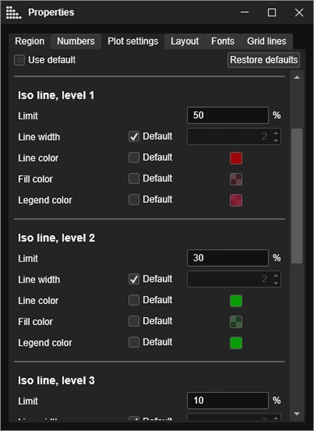
Iso-Illuminance
The Iso-Illuminance plot now has properties allowing you to style the graphic and set width/height of the axes etc.
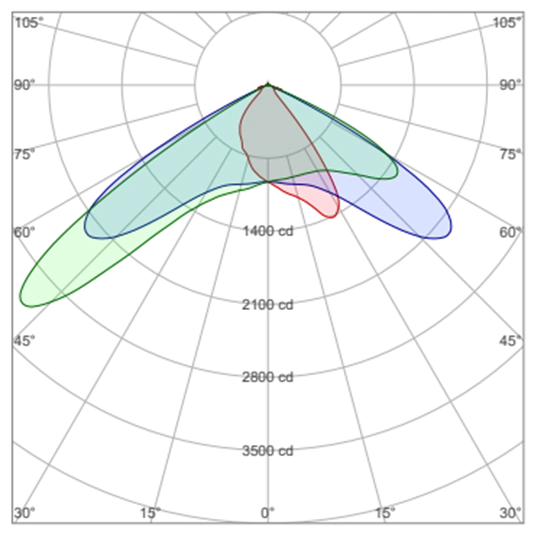
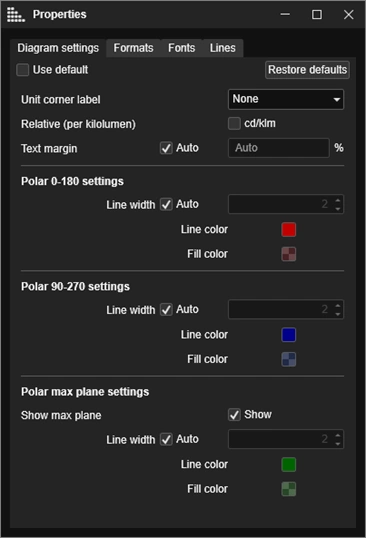
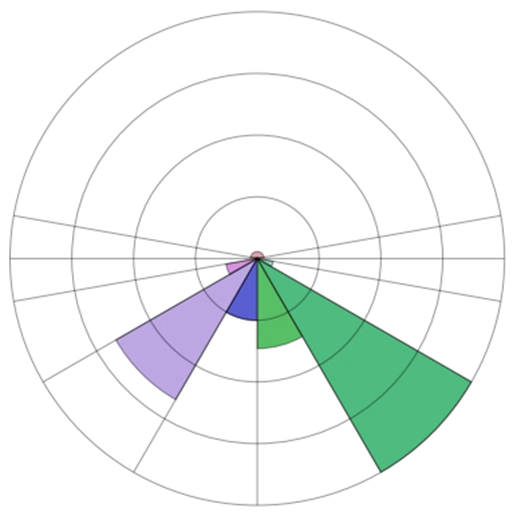
Polar plot
The polar plot now has properties allowing you to style it and configure units etc.
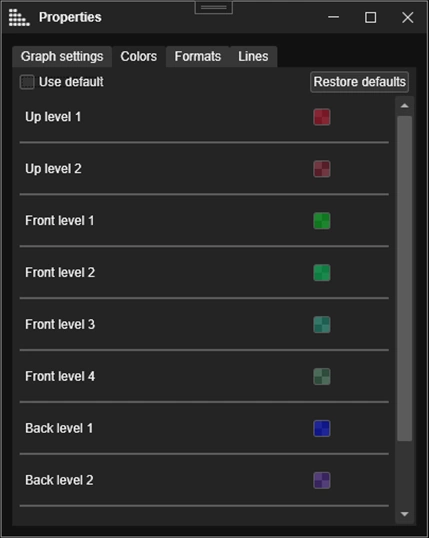
BUG diagram
The BUG diagram now has properties allowing you to style and configure it.
Other additions
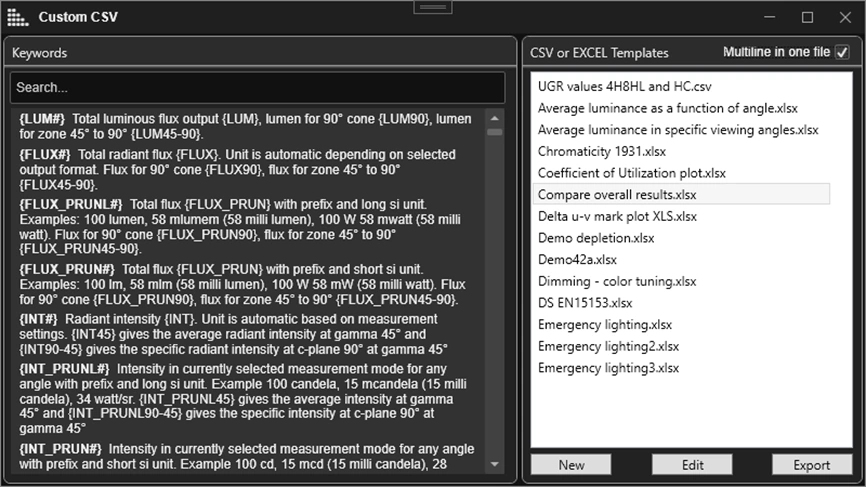
Multi-measurement csv export
You can now export excel files with one row of configurable information per selected measurement. This enables easy comparison of beam angles, flux output etc.
Go to File > Export > Excel > Custom, and tick the checkbox in the top right corner.
Vector graphics logo
In addition to bitmap, jpeg, and png, you can now use svg or pdf logos with the ‘Logo’ report graphic. In the new report explorer, click settings and select the logo tab to use your own logo.
Additional information editor
In the additional information editor table (accessed by double-clicking the ‘additional information’ field in the main window), you can now paste data directly from another measurement or Excel or similar. Note that pasting will override the already entered fields.
Support for GW Instek PSW 800-2 power supply
You can now use the GW Instek PSW 800-2 power supply with your Viso measurement equipment.