
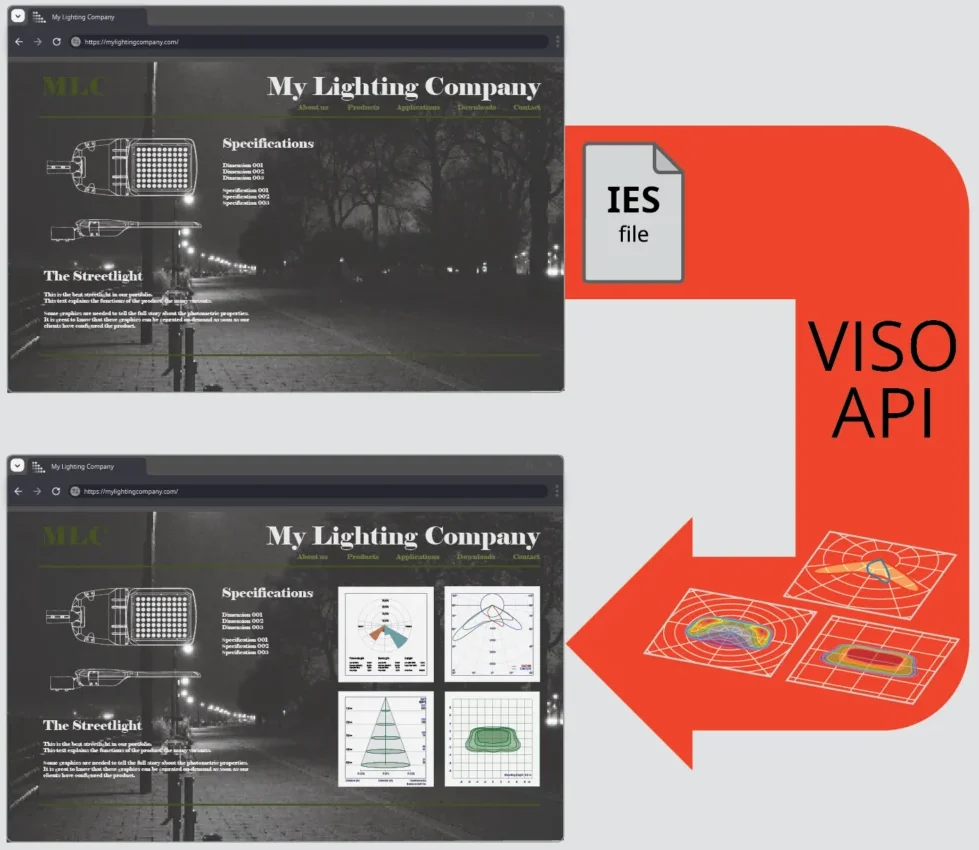
Display your photometrical skills to your clients
For your website: Get crisp photometry graphics in your own design. Viso Photometric API returns graphics in milliseconds based on any IES file. Get rid of tendous maintenance of your product database and rid of screen dumps.
on-demand graphics
on-demand reports
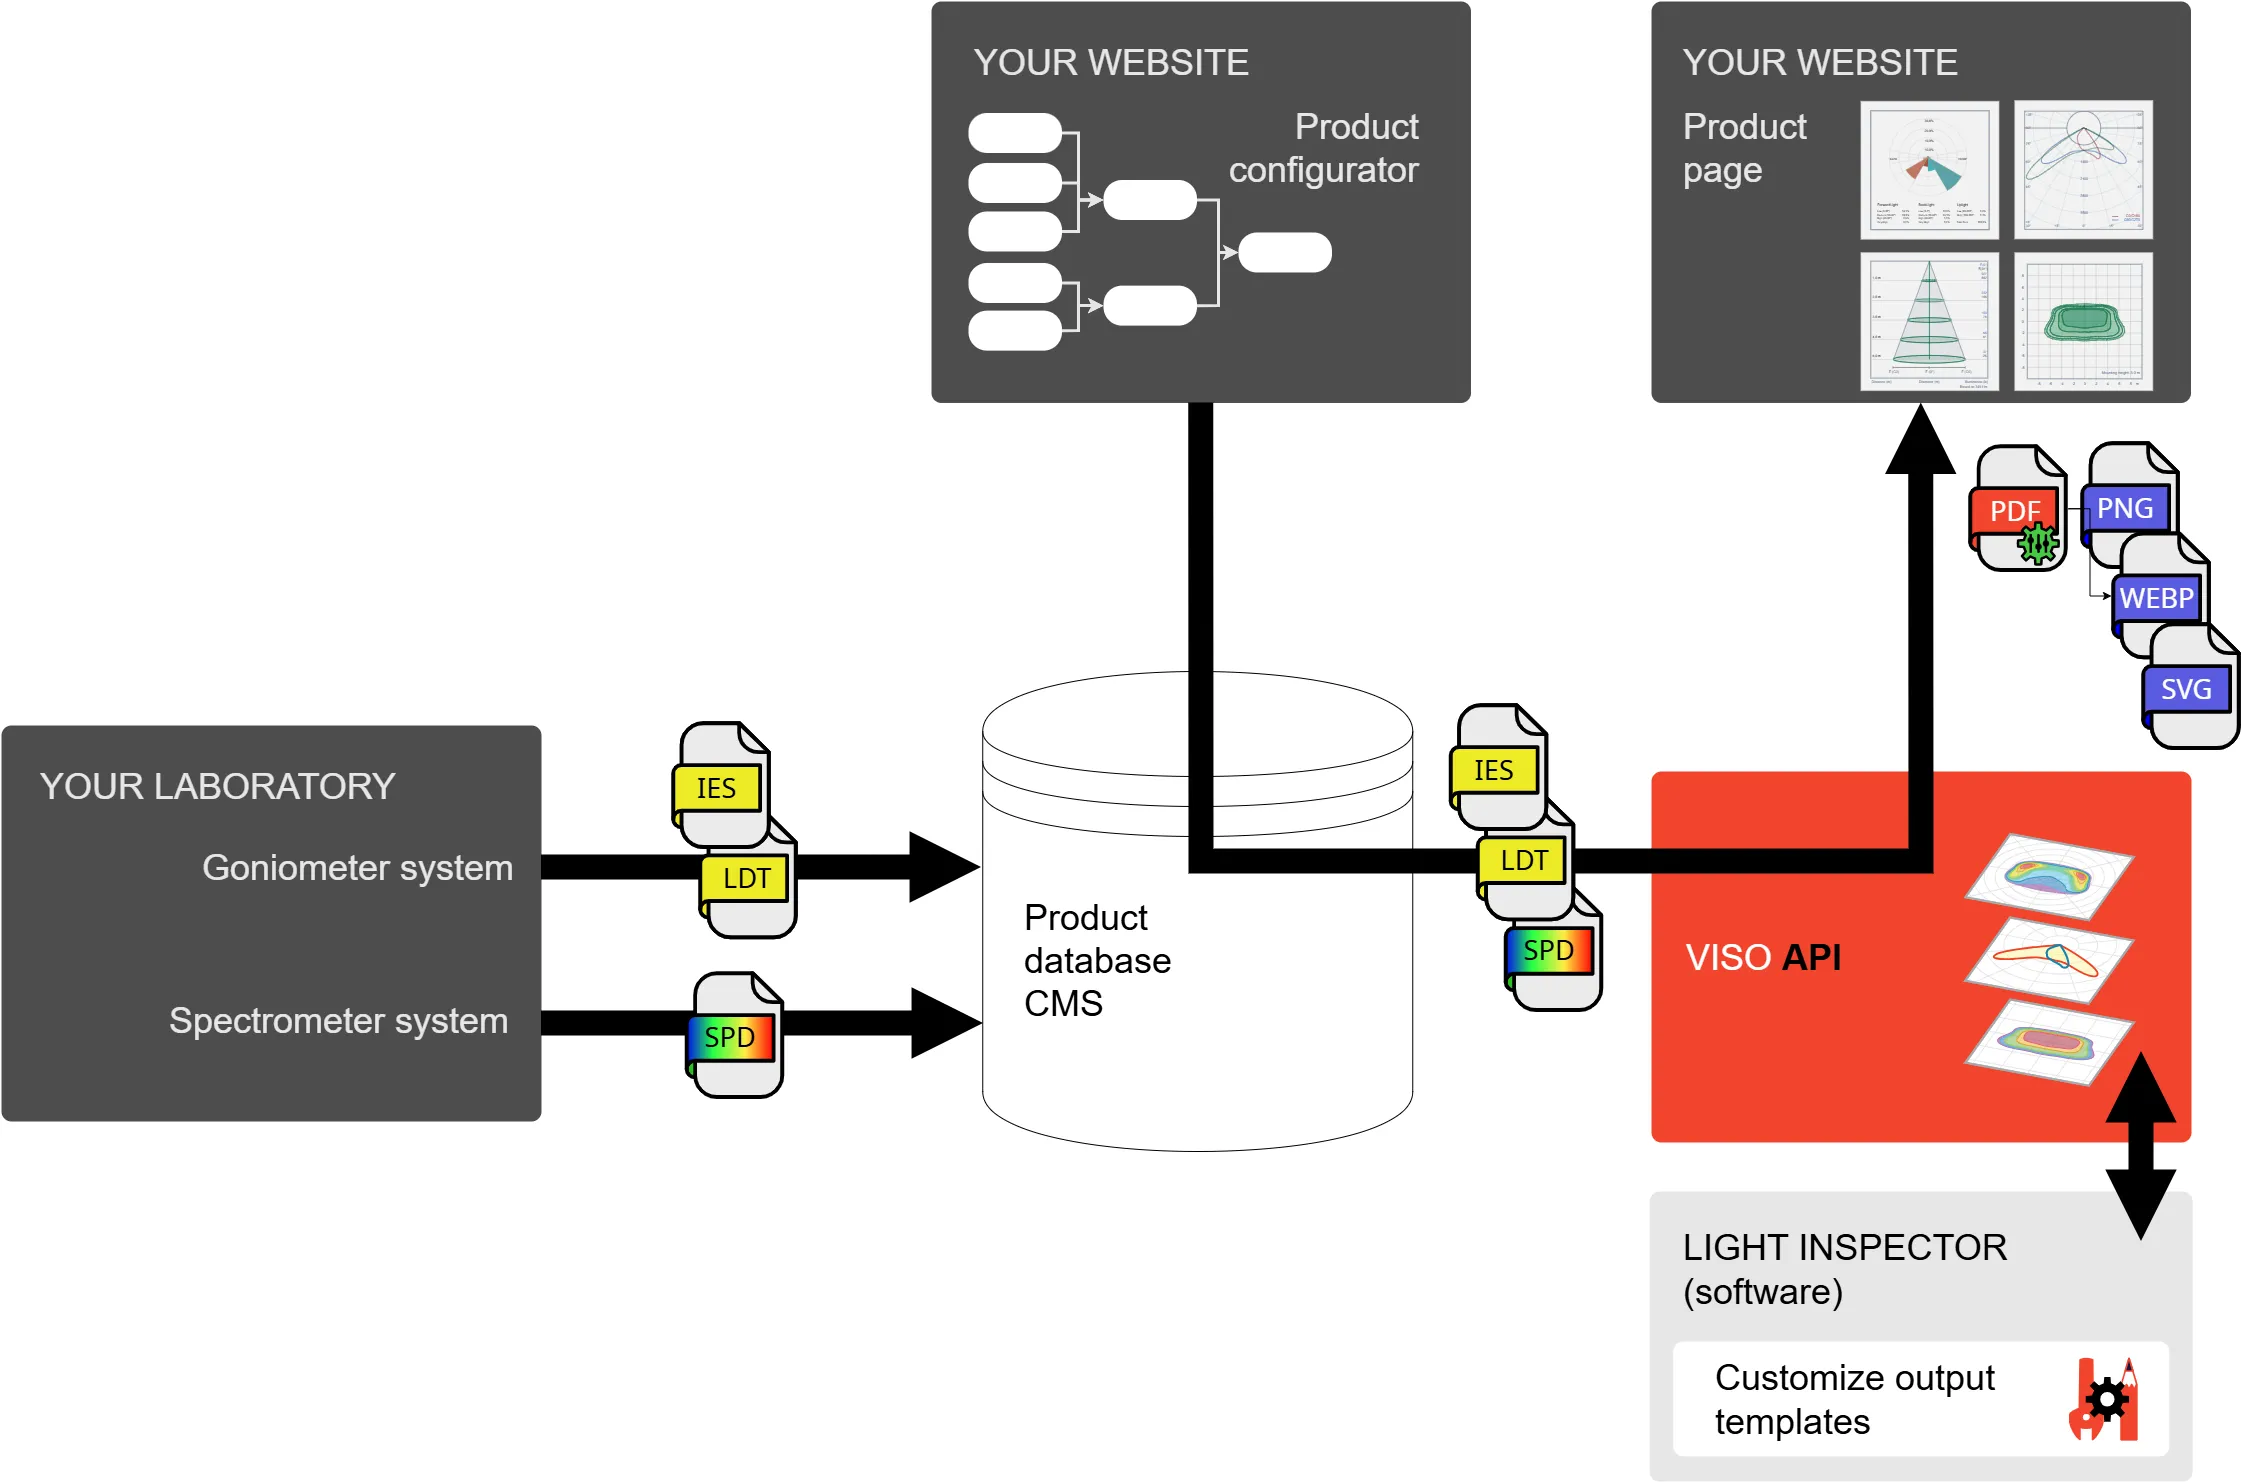
As professional lighting solutions become more configurable, static optical PDF reports are difficult to keep up with. With the Photometric API, however, this process is automated. Allow your clients to configure their product and exchange the IES/LDT file with the Viso Photometric API to receive a complete photometric PDF report.
Viso Photometric API
Standard version: 200.000 graphic generations per year.
Advanced version: Unlimited
Main ADVANTAGES
Work with LDT and IES files coming from all sources (measurement laboratories, your own system, Viso measurement systems, etc.)
Edit details, scale lumen packages, symmetrize, change between imperial and metric units, save as new files (also TM33) and PDF reports.
Full privacy: None of your data are stored on Viso’s servers
Get more information
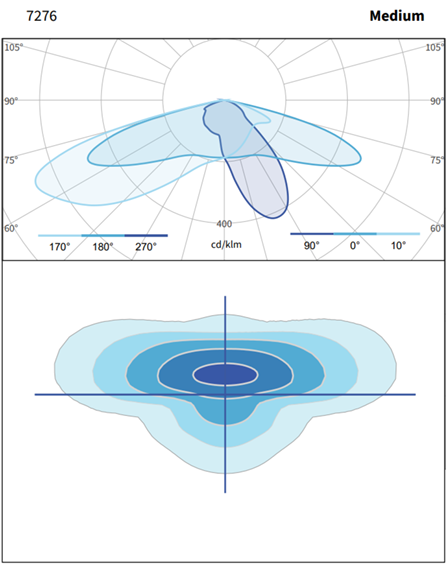
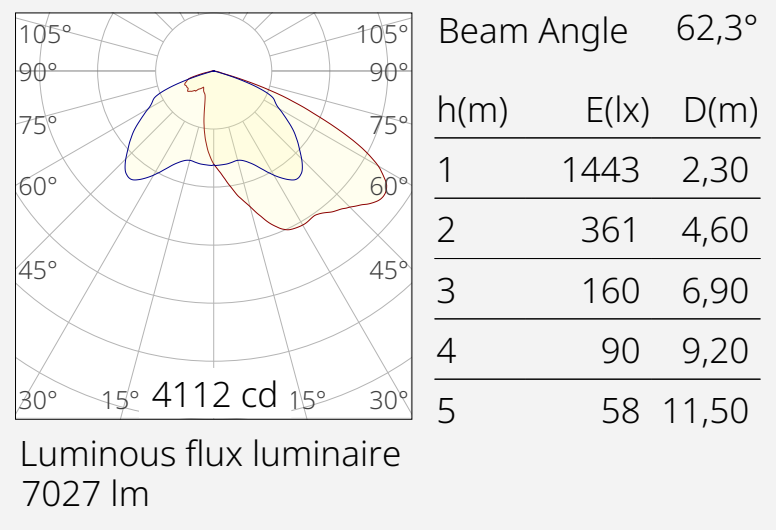
Examples – on-demand graphics
The examples show graphics generated on demand by the Viso Photometric API. Before using the API, this client used static bitmaps on their webpages. These examples demonstrate how static graphics can be replaced with on-demand graphics built using only a design template and an IES or LDT file.
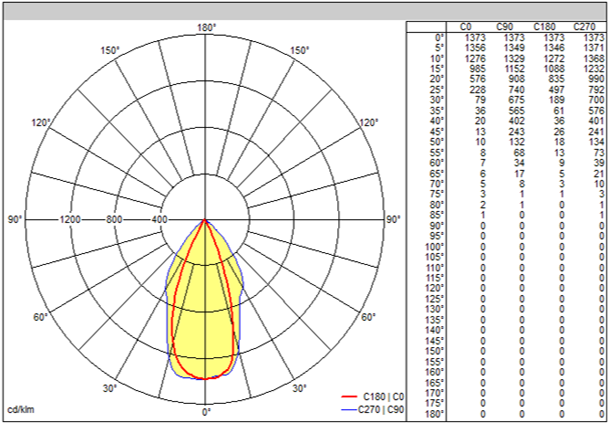
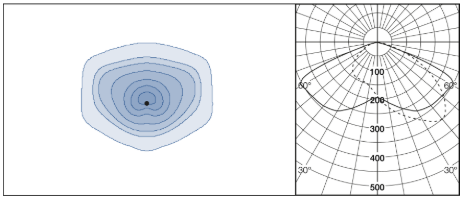
Before
After (click to see the vector PDF version)
Note how all line definitions are much more crisp. No jagged curves. Units added to intensity tabel. Free choice of line colours and shadings. All values created on-demand.
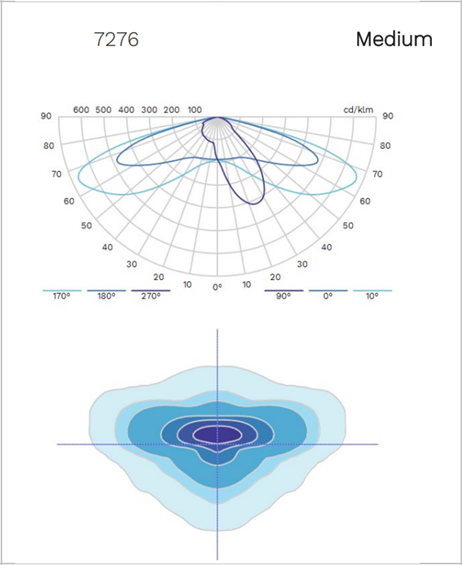
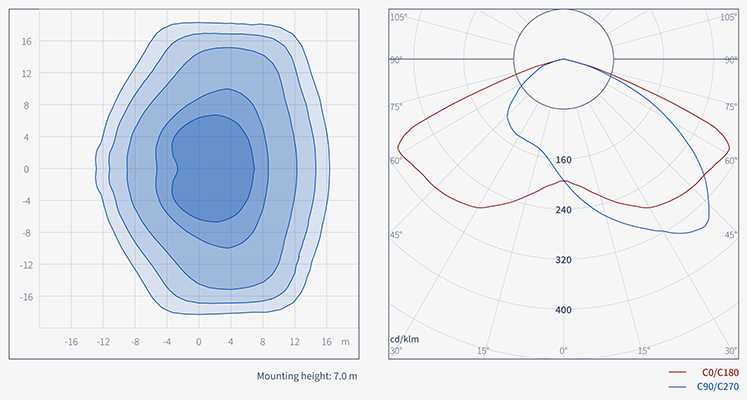
Before
After (click to see the vector PDF version)
Before
After (click to see the vector PDF version)
Note how the new images are in full color, and very crisp. PNG format enabled, so the new diagrams has transparent backgrounds and thous adapt to the color of this client’s webpage background. “Street side” has been set to turn to the right automatically. New automatic color legend added.
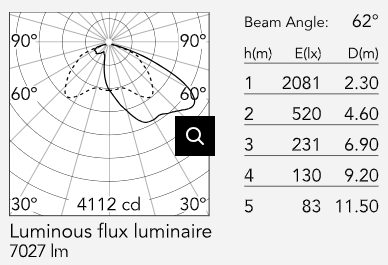
Before
After (click to see the vector PDF version)
Note that the all values are generated automatically, and there are actually errors in the “before” version.