Import IES files. Import LDT files. Import spectrum files. 

Use Viso Light Inspector® even if you do not have a Viso measurement system:
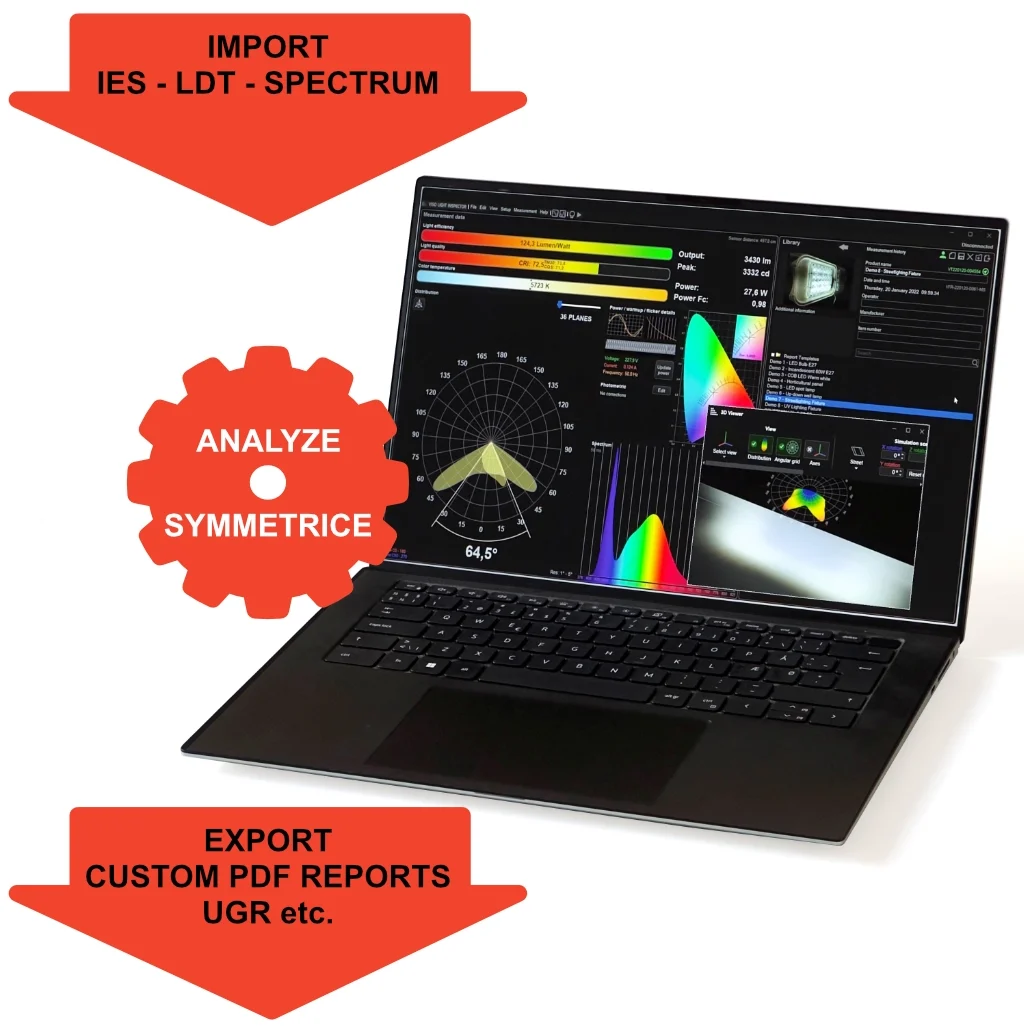
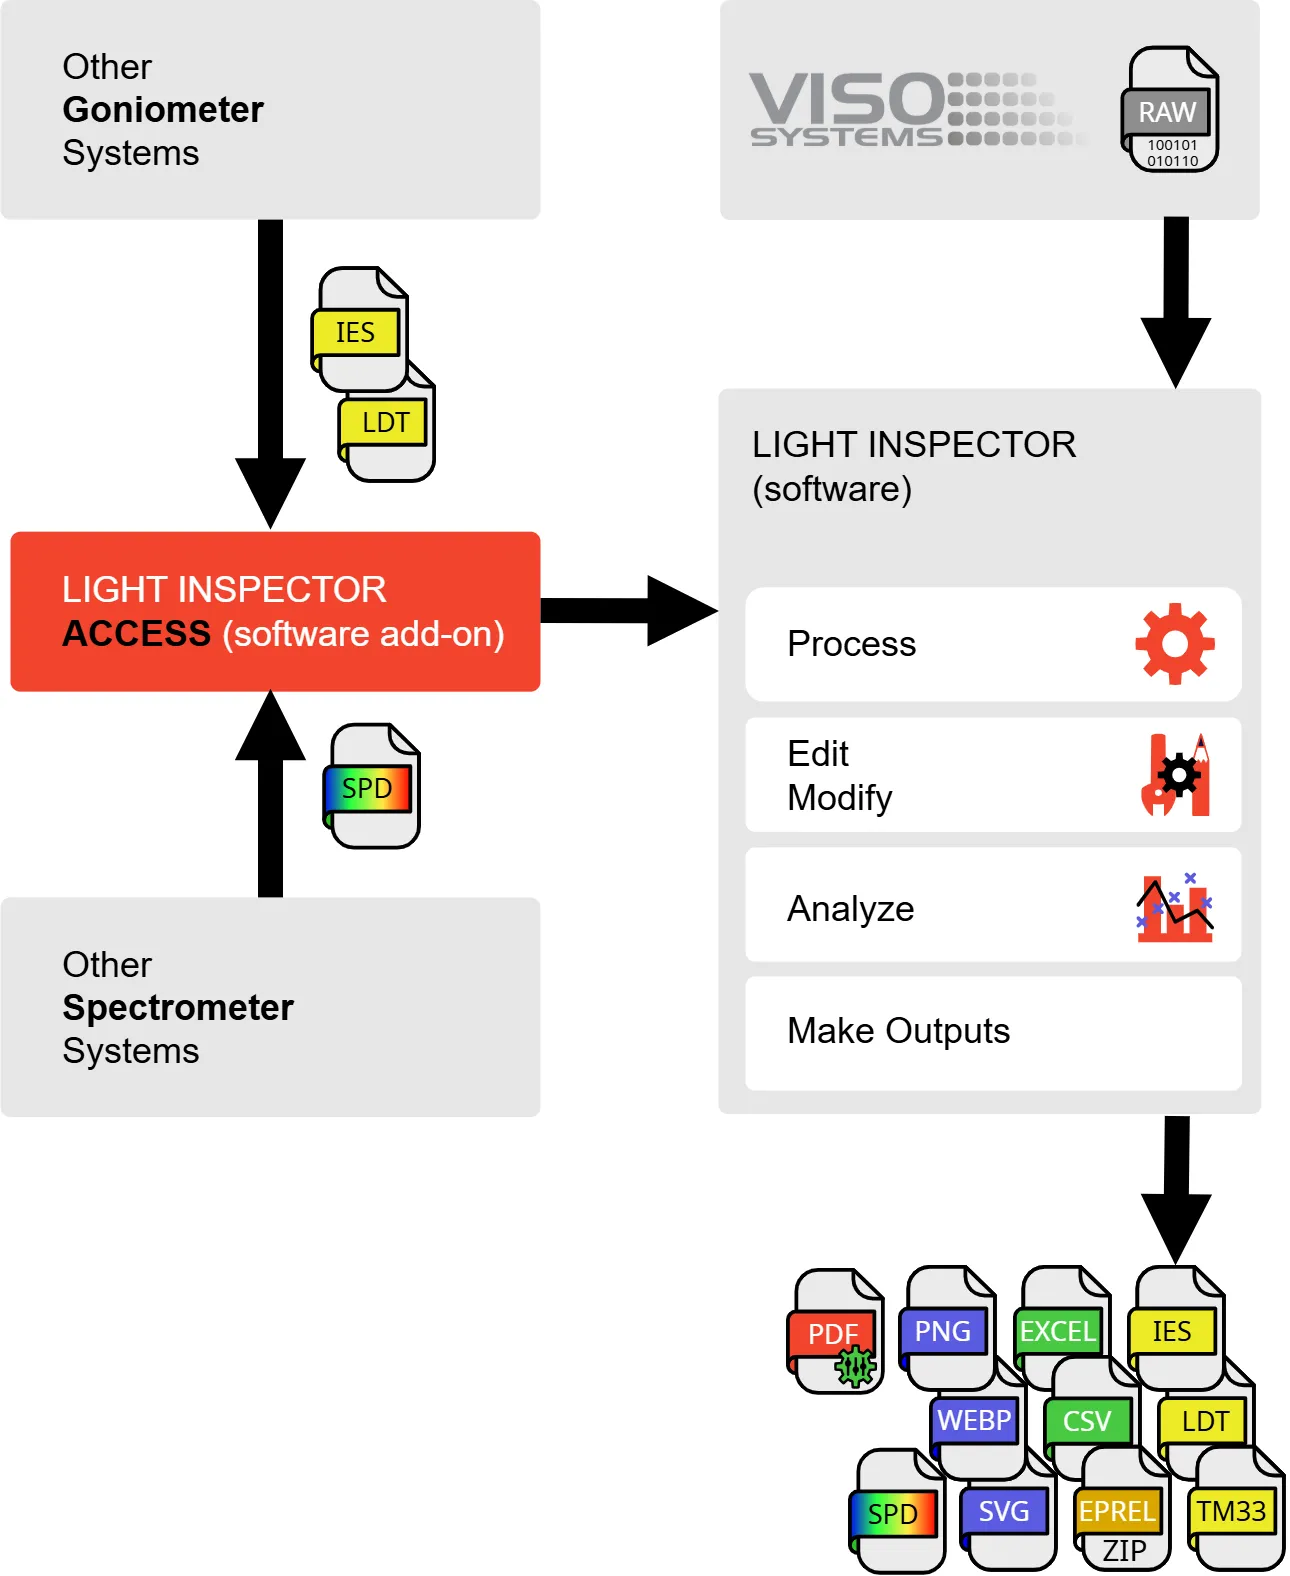
Light Inspector is the most advanced and intuitive light measurement software on the market – and you may also use it for viewing and editing IES and LDT files from other systems. You may even combine with spectrum files and make beautitful and comprehensive reports using your own template design.

Import IES - Import LDT

Advantages

Use with any IES or LDT file

Combine with spectrum files

Analyze, edit, symmetrice, make UGR

Make your own PDF report design templates

Subscribe to the import module only – the software itself is license-free

Downloads

Get more information

The most important features and outputs

The features below are all out-of-the-box features included in Light Inspector

Basic features

Measurement tools
  • Fully automatic type C measurements incl. stabilisation, resolution and sensor integration time
  • Standard measurement setup profiles (customizable templates)
  • Measurement time estimator and email when done
Photometry
  • Light intensity distributions and total lumen
  • Correction and modification tools
  • Symmetrization and UGR (Unified glare rating)
  • Power analysis and efficacy
  • Isolux and Isocandela diagrams
  • BUG rating (IES TM-15-11)
Spectrometry
  • Spectral power distributions
  • All contemporary color metrics:
    CCT, CRI, TM30, SDCM, Duv, etc.
Reporting and export
  • Result export to LDT and IES (customizable)
  • Standard PDF reports (customizable)
  • IES PDF reports
  • Standard raw data export (.xls/.csv)

Advanced features

Measurement tools
  • Interfacing with external AC/DC power supplies and power analyzers
  • Type-B measurements (table meaurements)
  • Measuring battery depletion
  • Measuring controllable light source (DALI/DMX/0-10V) with control sequence custom templates*
  • Measuring flashing light sources while flashing*
  • Measure flicker/TLA: SVM, PstLM, Flicker Index, IEEE 1789, Flicker %, Frequency, JA8/10 etc.*
Radiometry
  • Horticultural lighting (PPFD, PPF etc.)
  • Expanded spectral power distributions (UV-VIS-NIR) and total output*
  • Exposure analysis and working with doses, e.g. UV.
  • Special response curves /action curves (e.g. scotopic, melanopic, tec.)
Spectrometry
  • “Color-over-angle” (COA)
  • Integrative lighting metrics: Melanopic EDI and MDER
  • Power analysis and efficacy
  • CIExy, CIEuv, CIEu’v’, Spectral peaks, Dominant wavelength
Analysis tools
  • Advanced 3D viewer
  • Advanced result-over-angle browser
  • Total power harmonics, Displacement and Power Factors
Reporting and export
  • Read-to-upload EPREL zip files
  • Customizable raw data exports
  • Special reports: EN Energy G-star class, Spectral G-class, Dark sky, TM-30 ANNEX E, SSI index, COI,
  • Flash waveform analysis
  • Tracking measurements to external server
  • Export of detailed control sequence results (DALI/DMX, etc.)
  • requires special sensors or accessoires
light measurement software output1

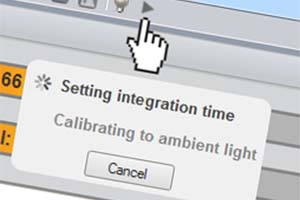
One click starts the fully automatic setup and the measurement cycle

light measurement software output4

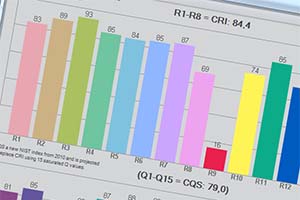
Comprehensive color quality data results, including CRI, CQS and TM30 values

light measurement software output2

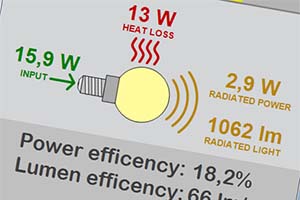
Power efficiency can be calculated using the radiated spectral energy

light measurement software output3

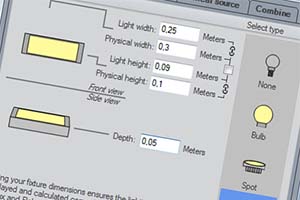
Easily add dimensions to your light sources and luminous areas