
Modernize your online presence with Viso Live Photometrics
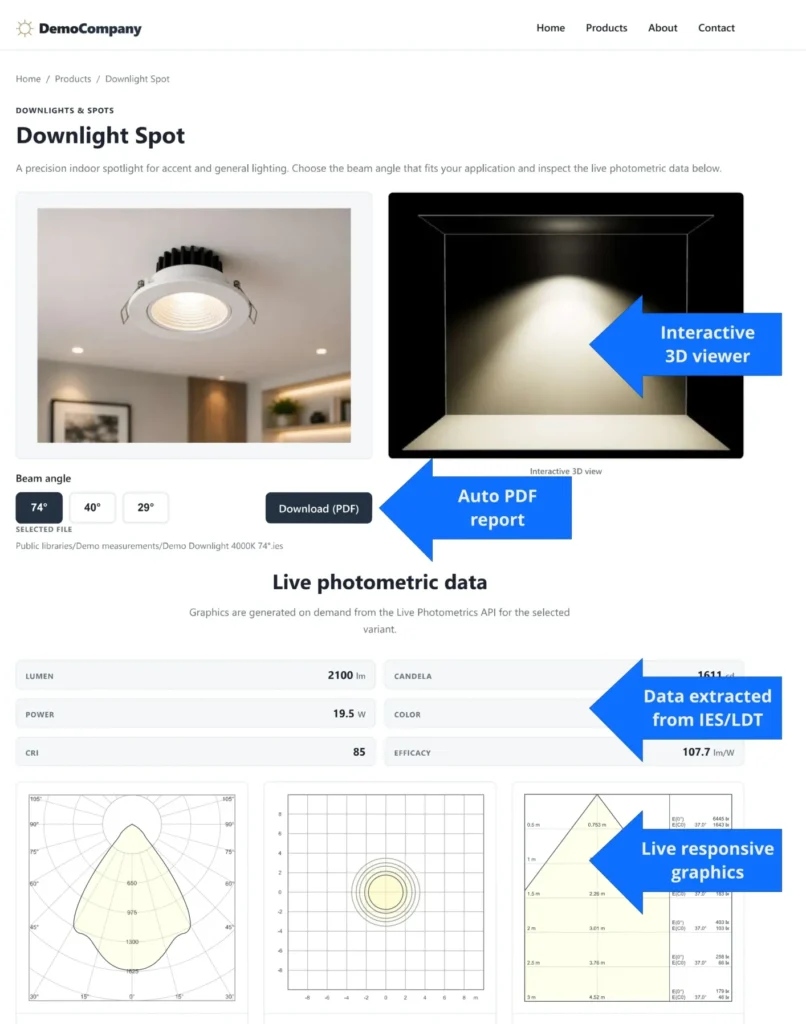
- Modernize, optimize, and automate technical presentations on your product website. With the Viso photometric API, you can easily and beautifully present the optical performance of your products.
- Say goodbye to tedious manual integration of bitmaps of polar curves, UGR tables, isolux diagrams, and much more into your website. Viso Live Photometrics generates all graphics on demand from the exchange of LDT and IES files.
- Leverage Viso’s extensive photometric expertise to create the most visually appealing and informative graphics for your website. Easily customize all graphics to match your design scheme, color palette, and data preferences.
- Get crisp, clear graphics that are very small in file size.
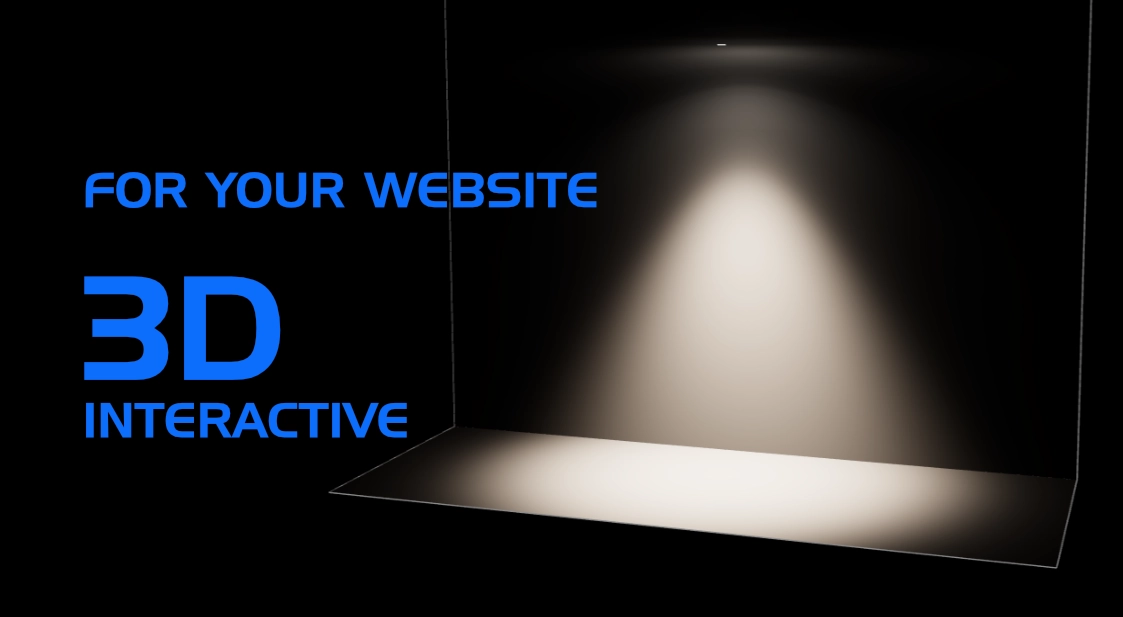
- Get the new Viso Luxiverse 3D viewer – the intereractive way of showíng your clients what your products can do.
We are proud to presesent this novel way of making even more use of your photometry files. The system will work no matter where you got your IES or LDT files from.
Watch this video to learn more
Or check into this demo website to try it out in practise
How to get more information about Viso Live Photometrics
- Contact Viso Systems at info@visosystems.com
- Get a personal live demonstration of how this would work for you